.png?width=700&height=366&name=eCommerce%20Marketing%20Insights%20for%20Brands%20to%20Engage%20DINKs%20(Dual%20Income%2c%20No%20Kids).png)
Have you ever heard the word “DINK” thrown around in conversation? This slang term is an acronym for “Dual Income, No Kids." Couples in DINK households are typically perceived to have higher disposable incomes because they do not have the expenses that come with raising children. Additionally, DINKs often spend less by being able to share general living expenses such as utilities, groceries, rent, and/or mortgage payments.
Whether it’s a new couple, “empty nesters,” or long-term partners who have simply decided not to have kids, DINKs can live off the benefits of both household members’ incomes, and in turn, potentially enjoy more disposable income. MikMak took a closer look at how DINKs are shopping so your brand can engage them effectively.
DINKs might be more willing to buy higher-priced items than couples with children
According to Brookings, it costs a family an estimated $310,605 to raise a child from birth to age 17. Without children, a couple can use that money for other things, including spending on their favorite brands. Luxury brands and higher-ticket items might see increased sales when targeting DINKs, as they are potentially more likely to splurge on high-end products that a couple negotiating the expense of raising children would otherwise deem to be too expensive.
FB/IG has the highest Purchase Intent Rate among social channels for DINKs
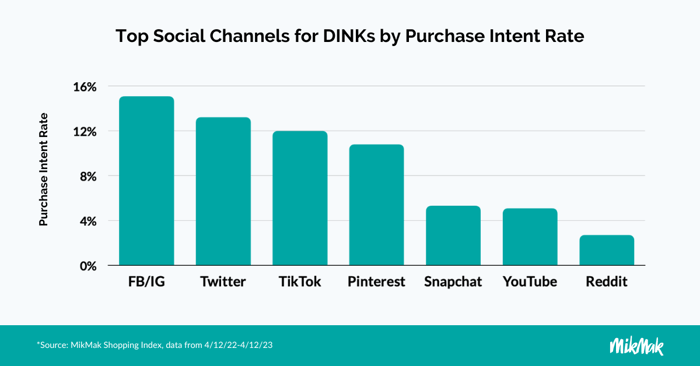
When looking at social channels, Meta’s Facebook and Instagram, saw the most in-market traffic and the highest Purchase Intent Rates from DINKs in the MikMak Shopping Index at 15.1 percent. Purchase Intent Rate means that when a member of a DINK household viewed Shoppable Media on Facebook or Instagram, they were more likely to proceed to a retailer than on other platforms. Twitter, which drove less traffic than other channels, saw the second highest Purchase Intent Rates at 13.2 percent. TikTok followed at 12 percent. Snapchat, YouTube, and Reddit rounded out the top social channels with Purchase Intent Rates of 5.3, 5.1, and 2.7 percent, respectively.

Beauty and Personal Care lead in Purchase Intent Rate among DINKs, when compared to other product categories
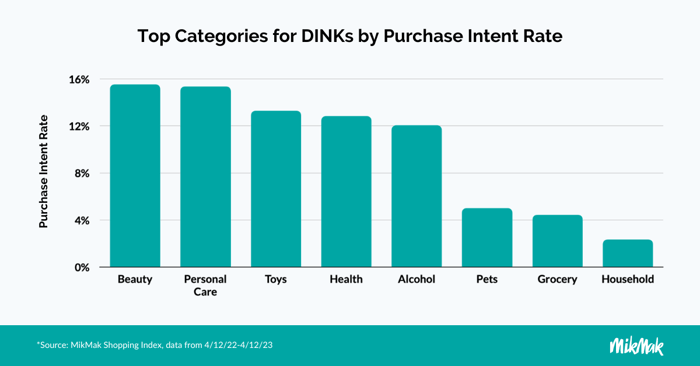
On a category level, DINK shoppers in the MikMak Shopping Index, showed the highest Purchase Intent Rates for Beauty products, at 15.5 percent (1.2x the most recent category benchmark of 12.5 percent). Meanwhile, Personal Care is second at 15.4 percent (2.6x the most recent category benchmark of 6.1 percent). Toys and Gaming is third at 13.3 percent (under the most recent category benchmark of 18.6 percent).
Health & Wellness brands has the fourth highest Purchase Intent Rate at 12.9 percent, more than doubling the most recent category benchmark of 6.2 percent. Alcohol and Grocery also have higher-than-average Purchase Intent Rates at 12 percent (1.5 x the category benchmark) and 4.4 percent (1.2 x the category benchmark), respectively.
Meanwhile Pet Care and Household Goods round out the top product categories for DINKs with Purchase Intent Rates of 5 percent and 2.3 percent, respectively.
Identify high-performing audience segments, such as DINKs, to personalize content accordingly
When targeting different demographic groups or audience segments, it is essential to have real-time insight into each cohort's unique trends and preferences. Partnering with an eCommerce enablement and analytics provider like MikMak, and leveraging MikMak Shopper Intelligence, allows you to do this and more. To find out how this can work for your brand, schedule a demo today.