Quarterly Commerce Marketing Benchmarks for Toys and Games Brands

Benchmark Overview and KPIs
Toys and Games brands operate in a highly seasonal, gift-driven category where shoppers move quickly between discovery, research, and purchase. Understanding when, where, and how shoppers express purchase intent is essential for capturing demand, optimizing media spend, and maximizing conversions.
MikMak’s quarterly Toys and Games commerce marketing benchmarks provide a data-backed view of brand media trends, shopper intent, and retailer engagement across global markets, helping brands contextualize performance and refine commerce-enabled activations across owned and paid channels.
This Q2 benchmark analysis is based on MikMak Shopping Index* data from April 1 to June 30, 2026.
The following proprietary MikMak Commerce KPIs were used:
- Purchase Intent Clicks
Measures high-intent shopper traffic by counting the number of times a shopper clicks through to at least one retailer during a single session within MikMak Commerce-enabled brand content. - Purchase Intent Rate
Measures the percentage of shoppers who click through to at least one retailer within MikMak Commerce-enabled brand content, signaling a strong conversion likelihood.
Q2 Key Findings
- Earlier seasonal demand: Shopper engagement varied by market, with demand peaking as early as January in France, March in the US, and May in the UK. These differences highlight the importance of aligning commerce activation with local seasonal shopping patterns rather than relying solely on the holiday period.
- Media investment strategies diverged across markets: While paid social and video strengthened in the US and UK, search remained the dominant commerce driver in Canada and France. The results show there is no one-size-fits-all media mix, reinforcing the need to optimize channel investment based on local shopper behavior.
- Retail preferences shifted toward specialist retailers: Marketplace leaders such as Amazon remained important across North America, but specialist retailers gained share in Europe. Smyths Toys became the leading retailer in the UK, while King Jouet entered the top three in France, demonstrating the value of maintaining a diversified retailer strategy across both marketplaces and category specialists.
United States
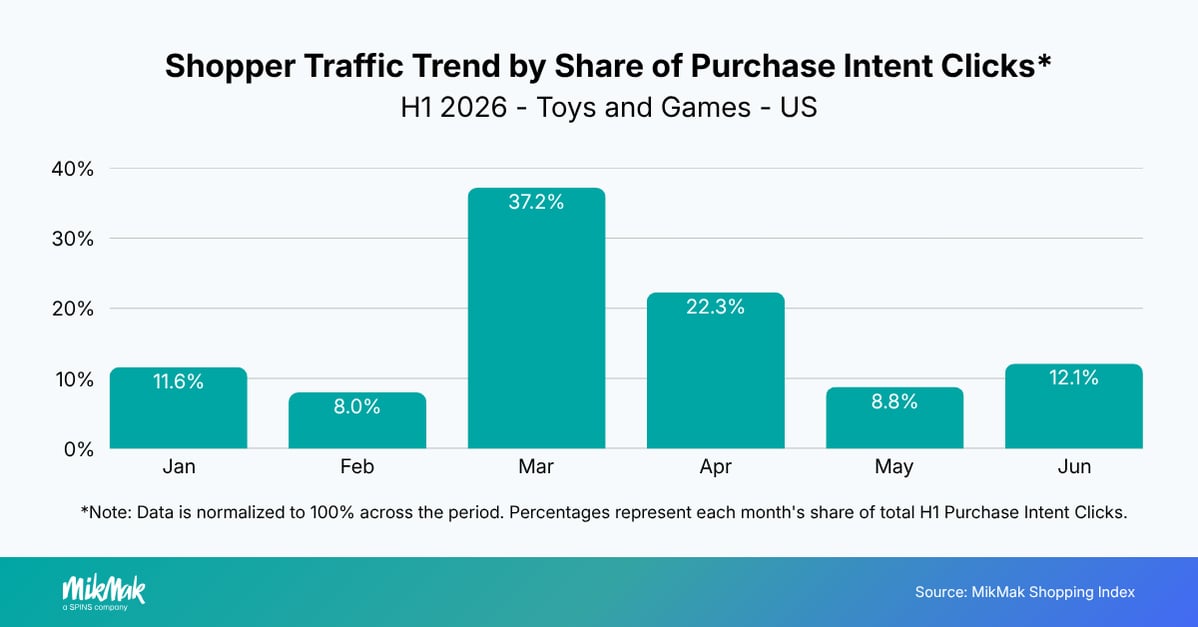
March accounted for 37.2% of H1 Purchase Intent Clicks, making it the strongest month of the first half of the year. Shopper engagement eased during Q2, with April contributing 22.3% of H1 activity before demand normalized across May (8.8%) and June (12.1%), suggesting that much of the category's momentum occurred during the spring buying season.
Conversion performance remained strong across channels
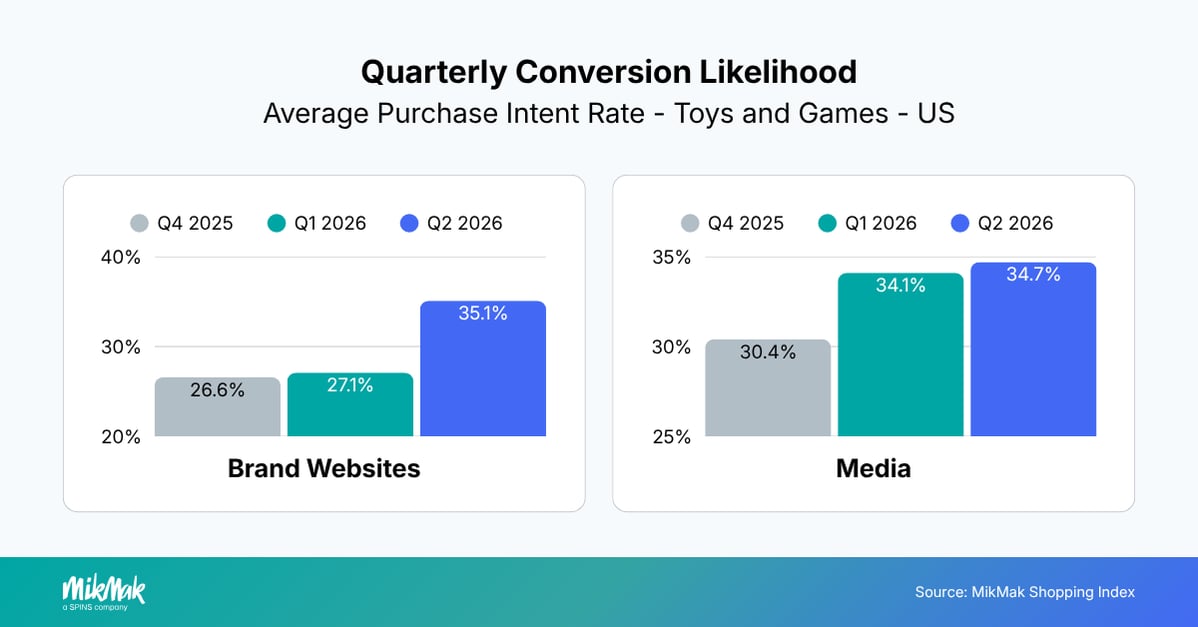
Purchase Intent Rates increased across both owned and paid experiences during Q2. Brand website Purchase Intent Rates rose from 27.1% in Q1 to 35.1%, while media Purchase Intent Rates remained exceptionally strong, increasing slightly from 34.1% to 34.7%.
Unlike many other CPG categories, Toys and Games generated strong Purchase Intent Rates across both commerce-enabled media and brand websites, demonstrating the value of enabling shoppers to purchase wherever inspiration occurs.
Paid social continued to lead shopper engagement
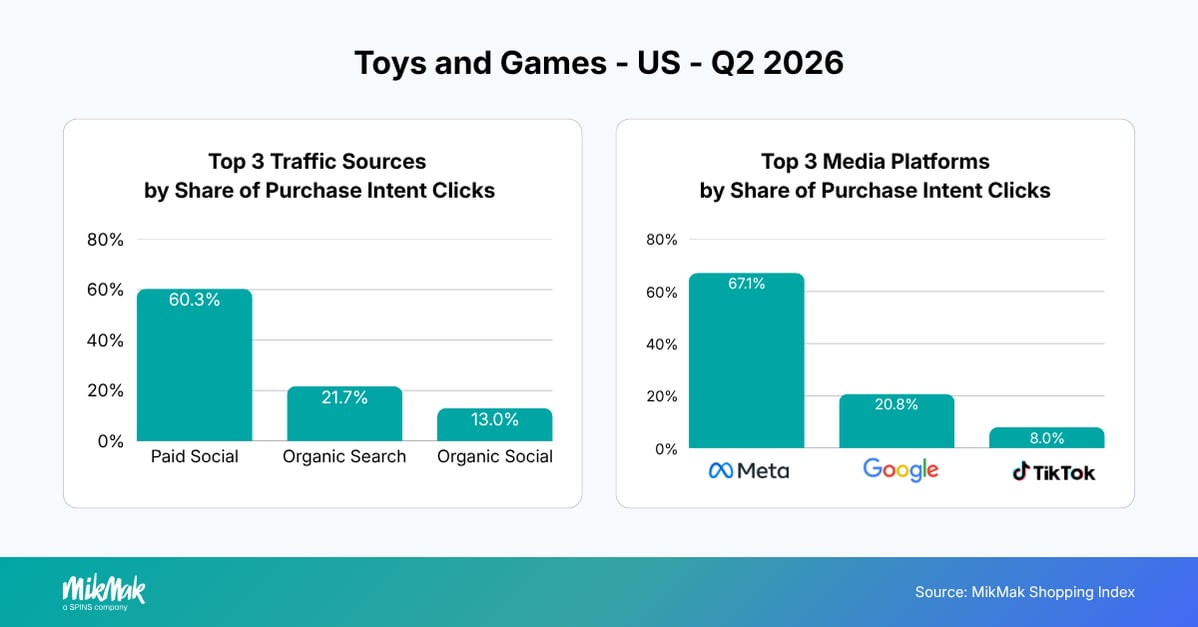
Paid social increased its share of Purchase Intent Clicks from 55.1% in Q1 to 60.3% in Q2, reinforcing its position as the primary driver of shopper engagement. Organic search declined from 29.9% to 21.7%, while organic social remained broadly stable at 13.0%.
At the platform level, Meta maintained its dominant position with 67.1% of Purchase Intent Clicks, while Google's share declined from 27.2% to 20.8%. TikTok, however, more than doubled its share from 3.1% to 8.0%, highlighting the growing role of short-form video in product discovery and commerce engagement.
Mass retailers continued to dominate purchase journeys
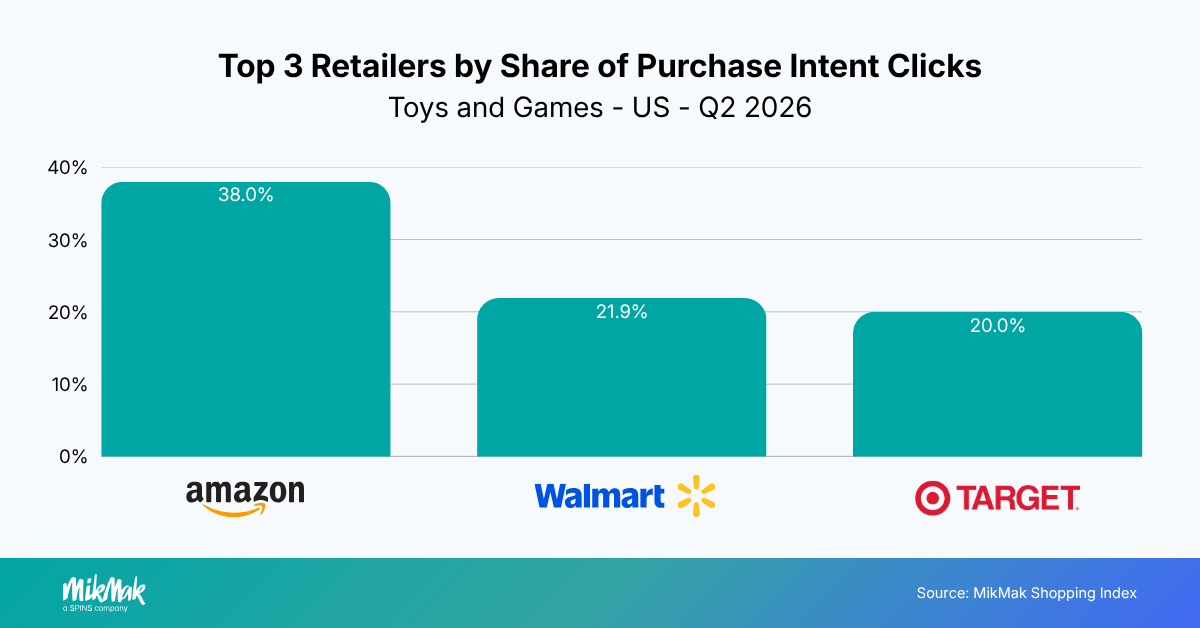
The retailer landscape remained remarkably stable during Q2. Amazon continued to lead with 38.0% of Purchase Intent Clicks, followed by Walmart (21.9%) and Target (20.0%). While each retailer saw a slight decline in share compared with Q1, the three retailers continued to account for nearly 80% of all retailer-directed shopper traffic from MikMak Commerce-enabled brand experiences, reinforcing their importance as the primary purchase destinations for the category.
Canada
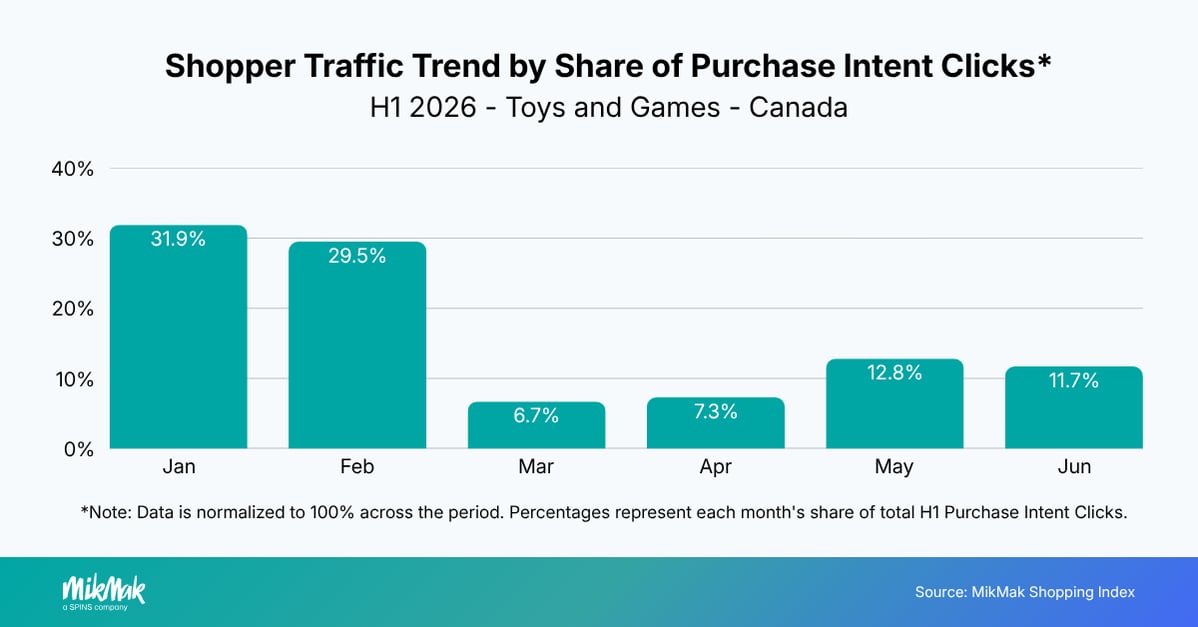
Shopper engagement was heavily concentrated in the early months of H1 2026, with January (31.9%) and February (29.5%) accounting for more than 60% of Purchase Intent Clicks. Activity slowed through March and April before recovering modestly in May (12.8%) and June (11.7%).
Conversion performance stabilized across channels
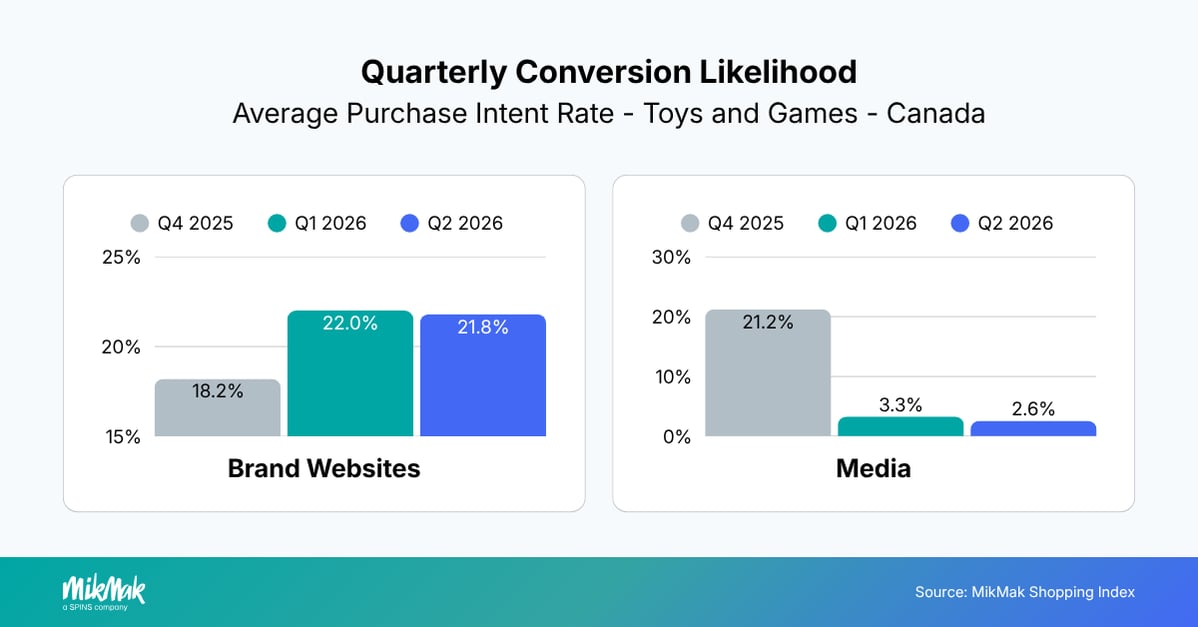
Brand website Purchase Intent Rates remained stable in Q2 at 21.8%, compared with 22.0% in Q1, while media Purchase Intent Rates eased slightly from 3.3% to 2.6%. The results suggest overall conversion performance remained relatively stable, with owned experiences continuing to capture the highest-intent shoppers while commerce-enabled media generated demand earlier in the purchase journey.
Paid social rebounded alongside search
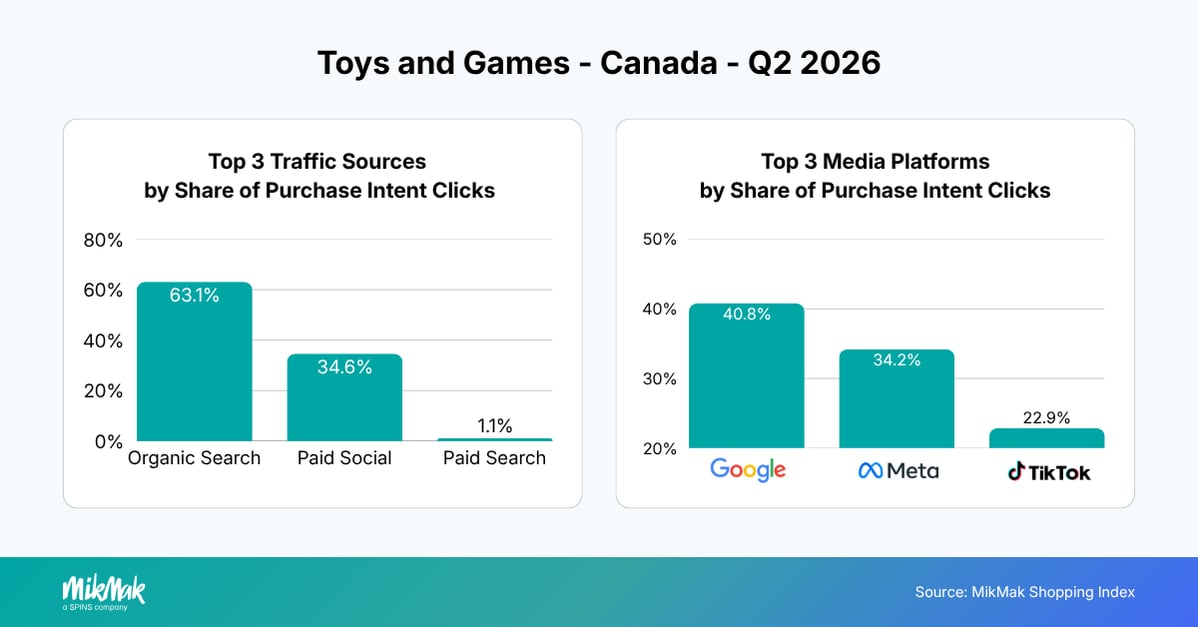
Organic search remained the largest source of Purchase Intent Clicks in Q2, although its share declined from 89.1% to 63.1%. At the same time, paid social increased sharply from 8.9% to 34.6%, suggesting brands expanded commerce-enabled media investment after a search-heavy first quarter.
As search remained the largest traffic source, Google became the leading commerce-driving platform with 40.8% of Purchase Intent Clicks, narrowly ahead of Meta (34.2%), while TikTok emerged as a major discovery platform with 22.9%, replacing Reddit in the top three.
Together, the results point to a more balanced media mix that combined strong search performance with renewed investment in social discovery.
Amazon extends its lead while retailer rankings remain stable
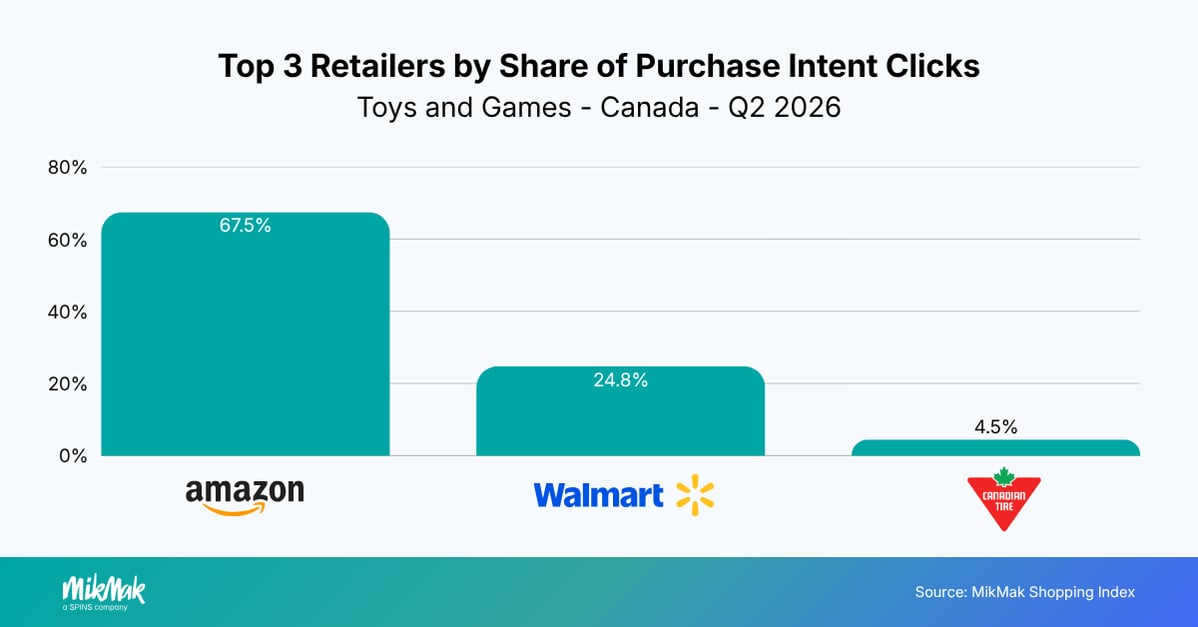
Amazon strengthened its position as the most popular retailer destination based on Purchase Intent Clicks in Q2 2026, increasing its share from 52.4% to 67.5% quarter over quarter. Walmart remained the second-largest destination, although its share declined from 39.7% to 24.8%, while Canadian Tire maintained third place and increased slightly from 3.8% to 4.5%.
Overall, the results suggest Canadian Toy shoppers became increasingly concentrated around Amazon during Q2, reinforcing the importance of maintaining strong marketplace visibility alongside leading mass retailers.
United Kingdom
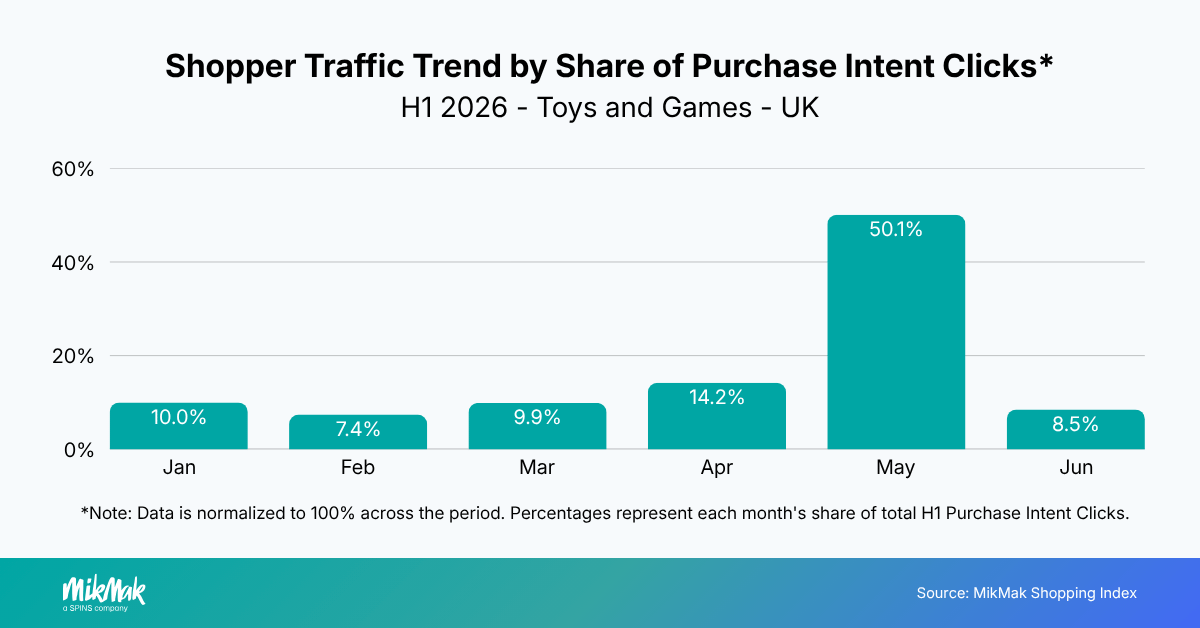
Shopper engagement accelerated significantly in May, which accounted for 50.1% of H1 Purchase Intent Clicks, making it the strongest month of the first half of 2026. Activity was more evenly distributed across the remaining months, with April contributing 14.2%, while January, March, and June each accounted for around 8–10% of shopper engagement. The results suggest seasonal events and promotional activity in late spring played a major role in driving Toys and Game demand.
Conversion performance improved across owned and paid channels
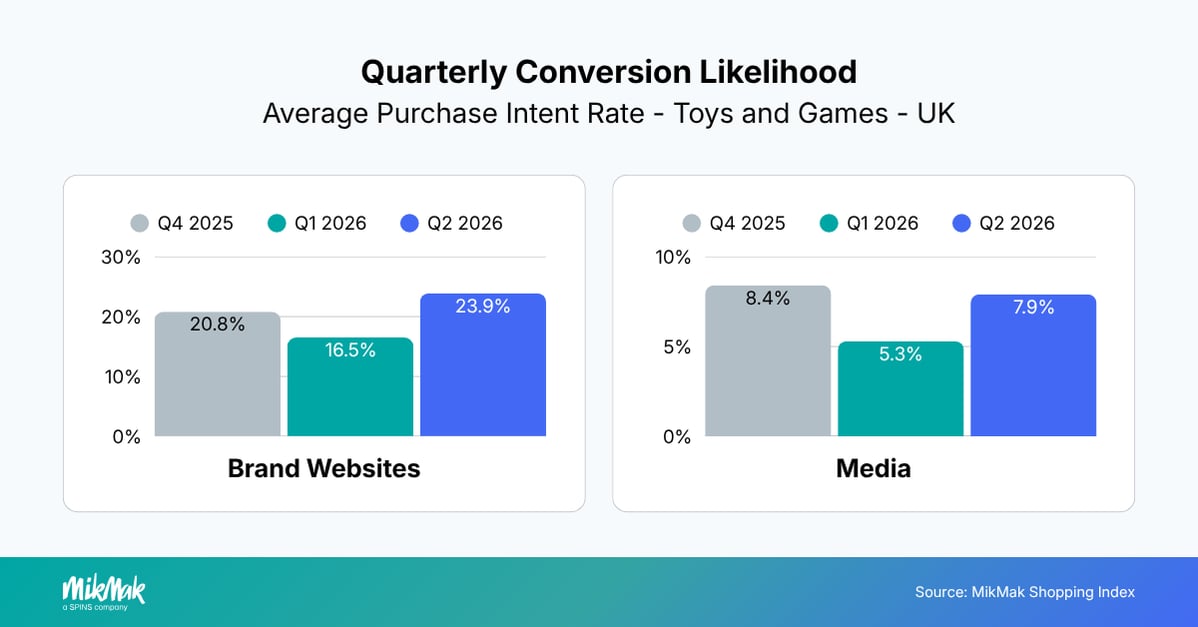
Purchase Intent Rates increased across both owned and paid experiences in Q2 2026. Brand website Purchase Intent Rates rose from 16.5% to 23.9%, while media Purchase Intent Rates increased from 5.3% to 7.9%. The improvement across both channels suggests brands generated stronger shopper intent during Q2, while commerce-enabled media continued to complement owned experiences by engaging shoppers earlier in the purchase journey.
Video and social became the primary drivers of shopper engagement
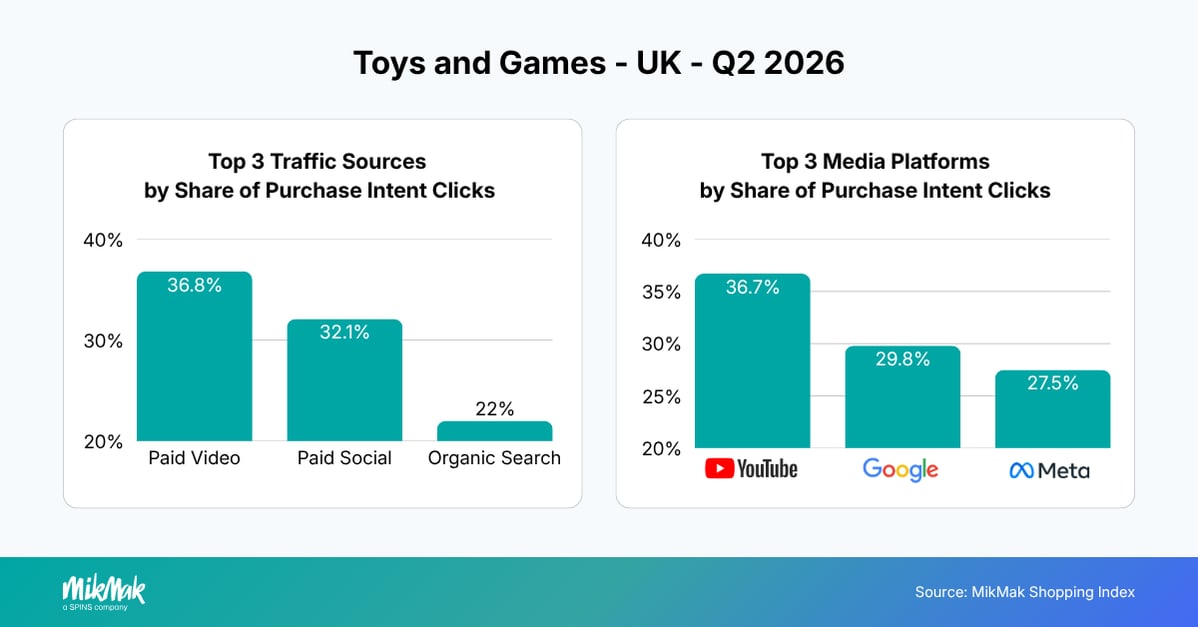
The UK media mix shifted significantly in Q2 2026. Paid video emerged as the largest source of Purchase Intent Clicks, accounting for 36.8% of shopper traffic, while paid social increased from 13.5% to 32.1%. At the same time, organic search declined from 63.3% to 22.0%, suggesting brands shifted media investment toward video and social to drive shopper engagement.
At the platform level, YouTube became the leading commerce-driving platform with 36.7% of Purchase Intent Clicks, while Meta more than doubled its share from 13.1% to 27.5%. Google's share declined from 79.8% to 29.8%, reflecting the broader shift from search-led discovery toward video and social activation.
Specialty retailers overtook marketplaces
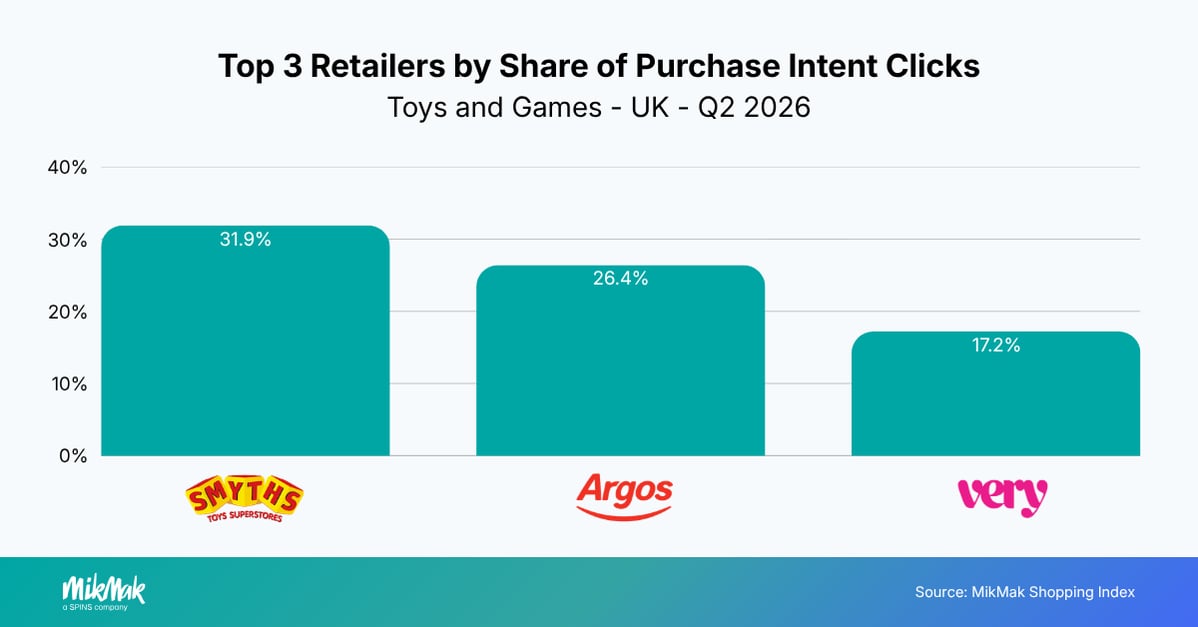
The retailer landscape shifted notably in Q2 2026 as Smyths Toys became the top retailer destination, capturing 31.9% of Purchase Intent Clicks, followed by Argos at 26.4% and Very at 17.2%. Amazon, which led in Q1 with 36.2%, dropped out of the top three and into fourth place.
The results suggest UK shoppers increasingly favored specialist Toy retailers during Q2, highlighting the importance of maintaining strong commerce activation beyond general marketplaces.
France
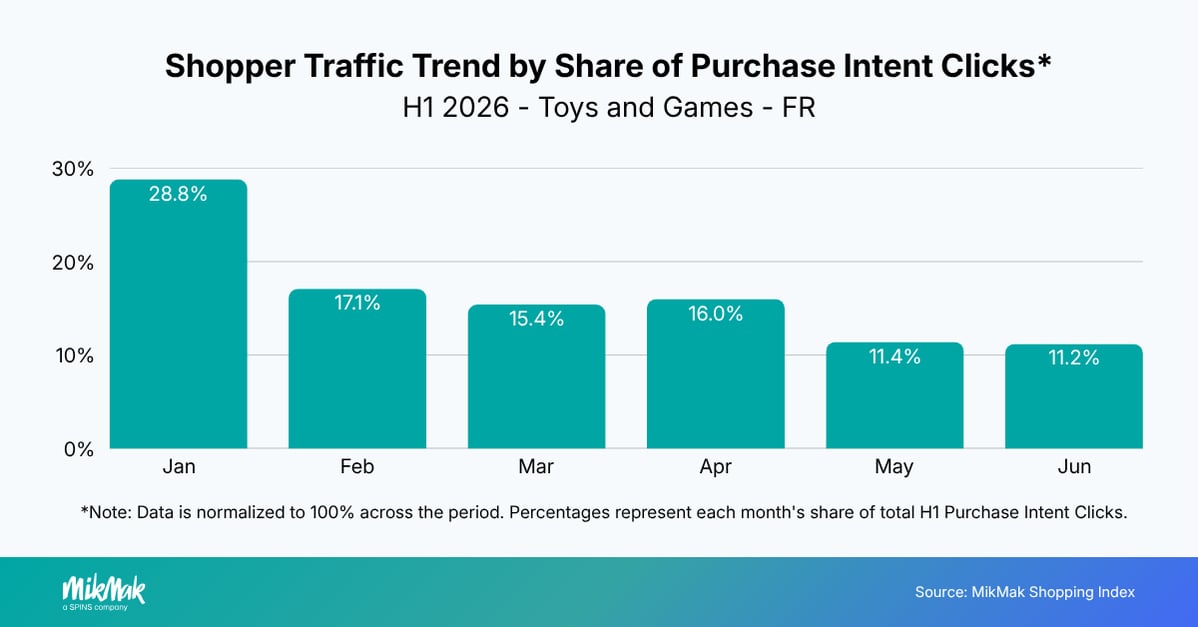
Shopper engagement was highest in January, which accounted for 28.8% of H1 Purchase Intent Clicks. Activity gradually moderated over the following months, with February (17.1%), April (16.0%), and March (15.4%) generating similar levels of shopper engagement, while May (11.4%) and June (11.2%) were the quietest months.
The results suggest French Toys and Game demand was front-loaded in the first half of the year before stabilizing through the second quarter.
Conversion performance remained resilient across channels
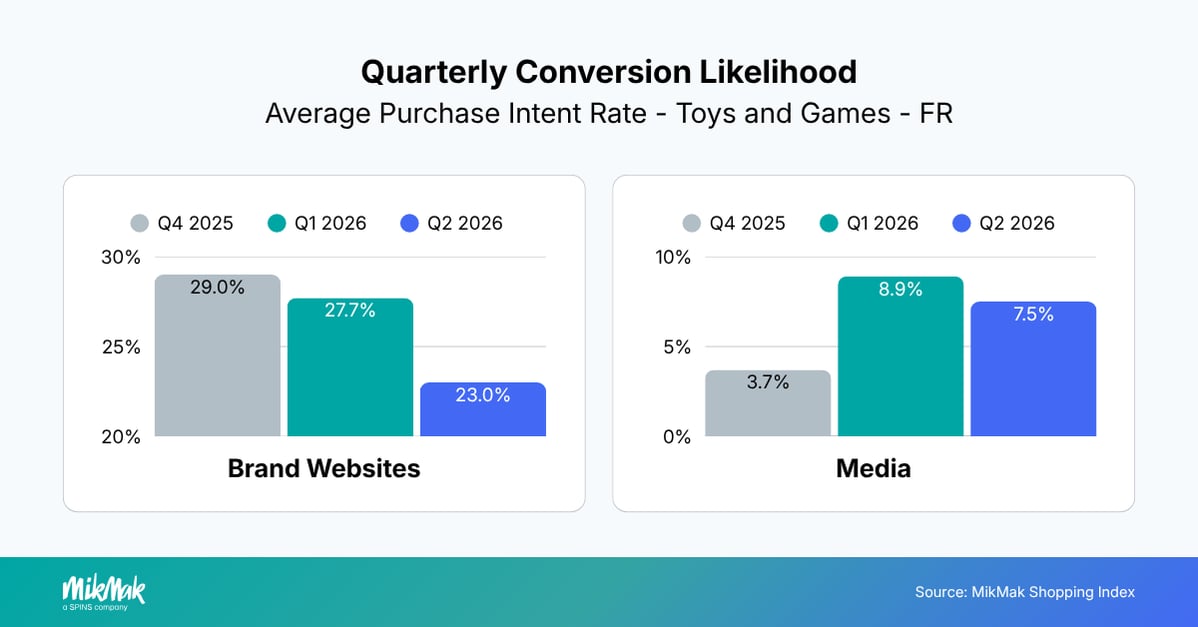
Purchase Intent Rates moderated slightly across both owned and paid experiences in Q2 2026. Brand website Purchase Intent Rates declined from 27.7% to 23.0%, while media Purchase Intent Rates eased from 8.9% to 7.5%.
Although Purchase Intent Rates moderated slightly, both channels continued to generate meaningful shopper intent, highlighting the complementary role of commerce-enabled media in driving discovery and brand websites in converting high-intent shoppers.
Search continued to dominate while social gained momentum
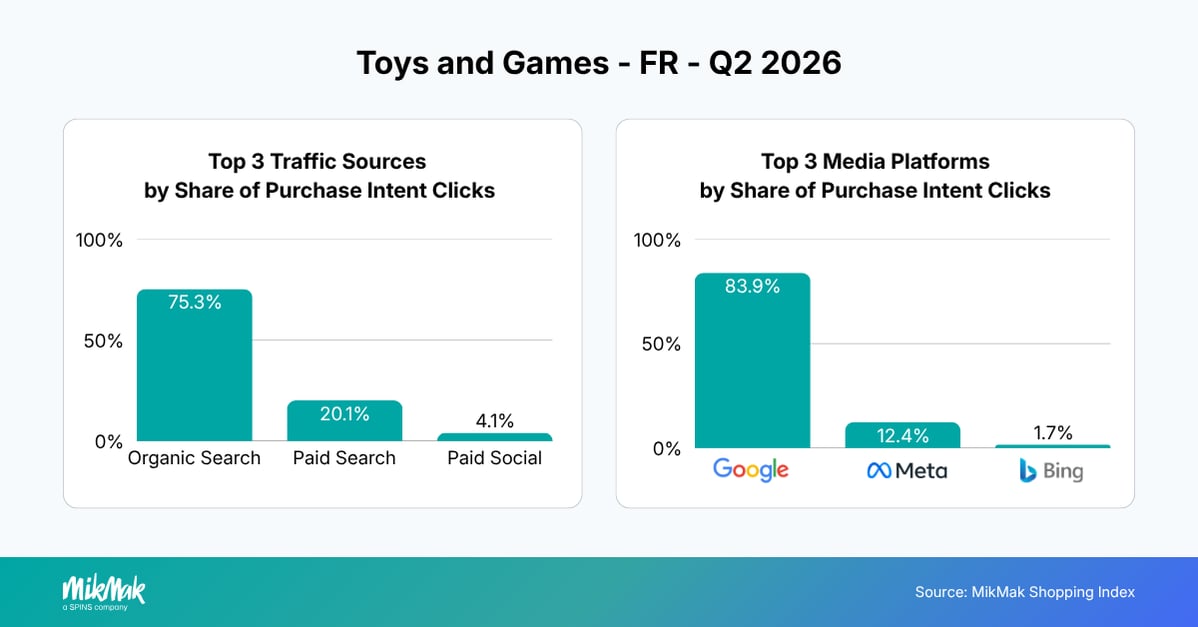
Organic Search remained the leading source of Purchase Intent Clicks in Q2 2026, increasing slightly from 74.6% to 75.3%. Paid search declined from 24.2% to 20.1%, while Paid Social entered the top three traffic sources with a 4.1% share, replacing Email.
At the platform level, Google remained the dominant commerce-driving platform despite its share declining from 95.7% to 83.9%. Meanwhile, Meta increased significantly from 1.4% to 12.4%, indicating that brands expanded social activation during Q2 while continuing to rely primarily on search to drive commerce engagement.
Specialty retailers gained ground alongside mass retail
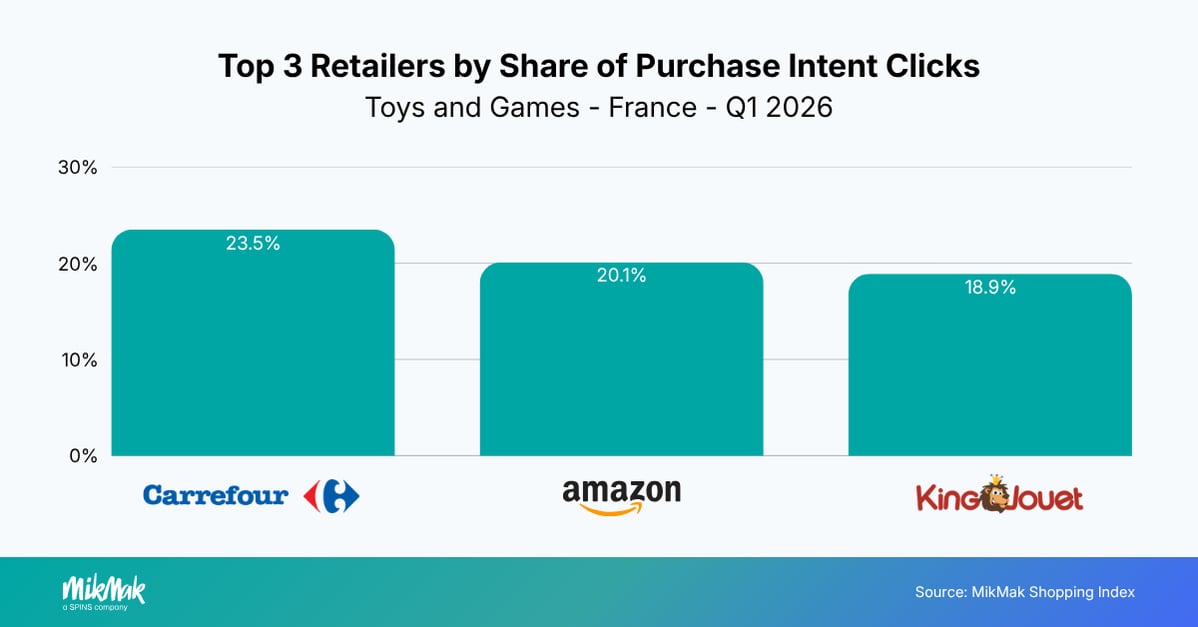
Carrefour remained the most popular retailer destination based on Purchase Intent Clicks, although its share declined from 28.1% to 23.5%. Amazon also moderated from 24.2% to 20.1%, while King Jouet entered the top three with 18.9%, replacing CDiscount. The results suggest shoppers continued to rely on mass retailers and marketplaces, while specialist toy retailers strengthened their role during Q2, reinforcing the importance of maintaining a diversified retailer strategy.
Key Takeaways
- Adapt media investment to local shopper behavior: Media performance varied significantly across markets. While paid social and video gained momentum in markets such as the US and UK, search remained the dominant commerce driver in Canada and France. Continuously monitoring commerce performance allows brands to optimize channel investment based on where shoppers are most likely to engage and purchase.
- Balance owned experiences with commerce-enabled media: Strong Purchase Intent Rates across both brand websites and commerce-enabled media demonstrate the value of a full-funnel commerce strategy. Brand websites convert high-intent shoppers, while commerce-enabled media captures demand earlier in the purchase journey and provides valuable shopper insights.
- Build a diversified retailer strategy: Retailer preferences differed considerably by market. While Amazon remained a dominant destination across North America, specialist retailers such as Smyths Toys in the UK and King Jouet in France gained share. Brands should ensure products are discoverable across both marketplaces and leading category retailers to maximize shopper reach and conversion.
Curious to see how MikMak helps brands connect marketing with commerce and unlock first-party shopper data? Schedule a demo today.

*The MikMak Shopping Index was developed to provide a standardized set of metrics, methodology, and benchmarks to help drive brands’ business results and strategy. It is a collection of key eCommerce KPIs collected across hundreds of brands, over 250 channels, and more than 8,000 retailer integrations worldwide to understand consumer online shopping behavior.
Ready to Grow Your Brand in Real-Time?
View All Resources