Quarterly Commerce Marketing Benchmarks for Alcohol Brands
Benchmark Overview and KPIs
As media budgets face increasing scrutiny and shopper behavior evolves, Alcohol marketers need a clearer understanding of which digital experiences actually drive shoppers toward purchase. Measuring purchase intent across channels helps brands identify where marketing is creating meaningful engagement, and where there's room to optimize.
MikMak’s quarterly Alcohol commerce marketing benchmarks provide a data-backed view of brand media trends, shopper intent, and retailer engagement across global markets, helping brands contextualize performance and optimize commerce-enabled activations across owned and paid channels.
This Q2 benchmark analysis is based on MikMak Shopping Index* data from April 1 to June 30, 2026.
The following proprietary MikMak Commerce KPIs were used:
- Purchase Intent Clicks
Measures high-intent shopper traffic by counting the number of times a shopper clicks through to at least one retailer during a single session within MikMak Commerce-enabled brand content. - Purchase Intent Rate
Measures the percentage of shoppers who click through to at least one retailer within MikMak Commerce-enabled brand content, signaling a strong conversion likelihood.
Q2 Key Findings
- More consistent shopper engagement: Shopper demand became more evenly distributed across H1 in the US, while Canada saw a June surge and the UK recorded its highest engagement at the start of the year, reinforcing the value of always-on commerce strategies.
- Brands balanced paid social with growing search activity: Paid social remained the largest driver of shopper traffic across North America, while search gained share, particularly in the US. In the UK, brands increased investment across both channels, creating a more balanced media mix.
- Both owned and paid experiences drove strong conversion: Brand website Purchase Intent Rates improved across all three markets year over year, while commerce-enabled media continued to generate measurable shopper intent, highlighting the value of combining owned experiences with multi-retailer shoppable media.
For a broader view of Alcohol shopper trends throughout the year, also explore our recent Alcohol Commerce Marketing Guide.
United States
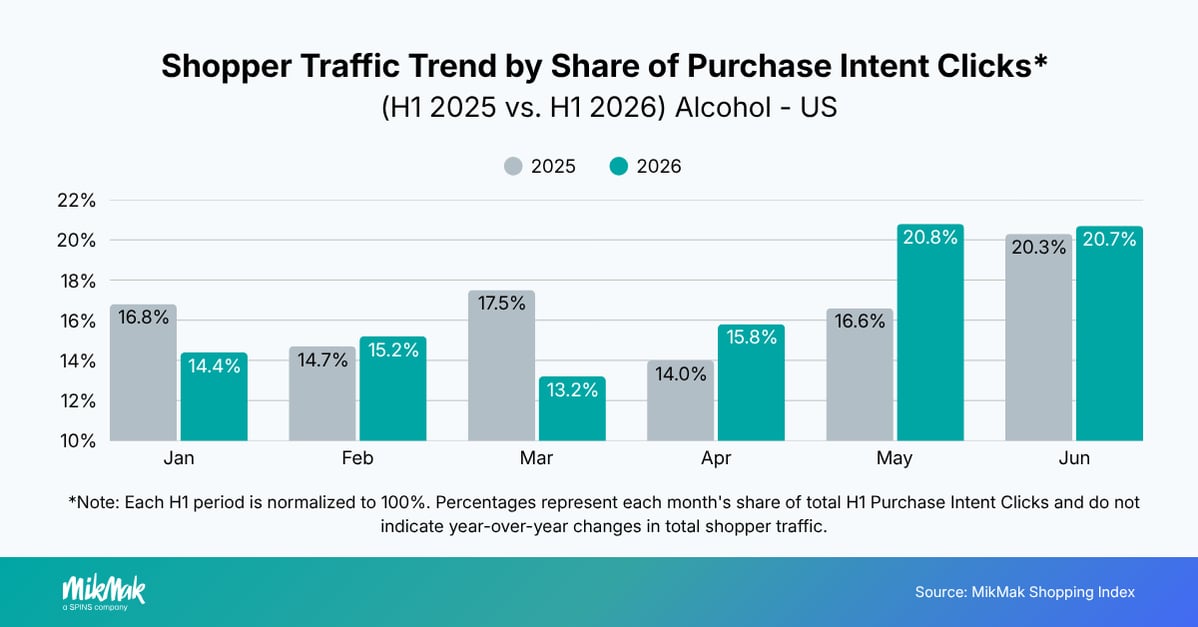
In H1 2026, May and June represented the largest shares of Purchase Intent Clicks at 20.8% and 20.7%, respectively, while activity remained relatively consistent across the six-month period.
This pattern shows that shopper engagement extended beyond early-year occasions such as the Super Bowl and Valentine's Day.
Diverging conversion trends reveal media opportunity
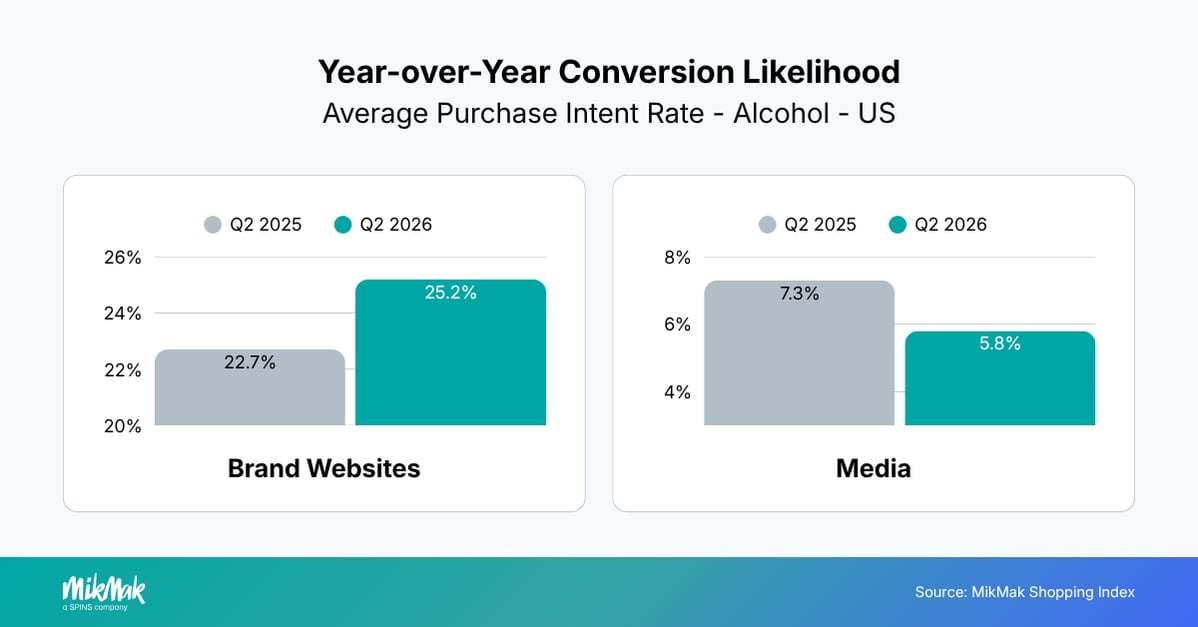
Brand website Purchase Intent Rates increased from 22.7% to 25.2% year over year, while media Purchase Intent Rates slightly declined from 7.3% to 5.8%.
The diverging results highlight an opportunity for Alcohol brands to strengthen the path from media engagement to purchase destinations. Improving media conversion efficiency could help capture more purchase intent, while maintaining the strong conversion performance already achieved on brand websites.
Social remained the leading traffic driver, while search gained momentum
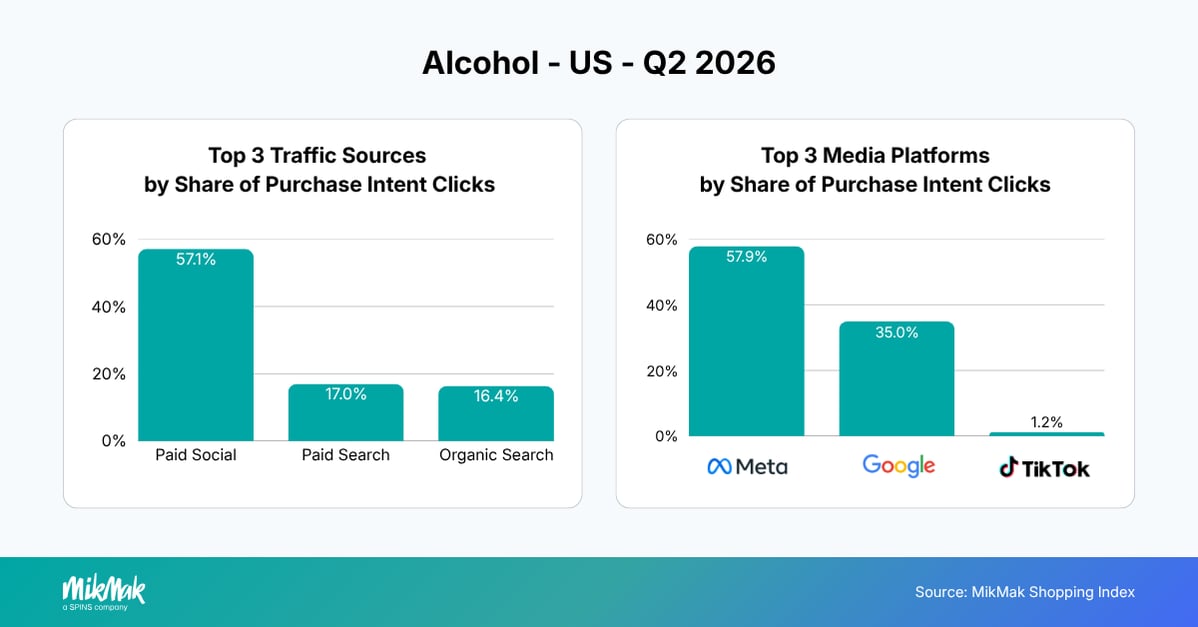
Paid social continued to generate the largest share of Purchase Intent Clicks in Q2 2026 at 57.1%, while both paid search (17.0%) and organic search (16.4%) increased their share compared with the previous year. Google also strengthened its position as a commerce-driving platform, increasing its share from 31.9% to 35.0%, while Meta remained the leading platform at 57.9%. Together, the results point to a more balanced media mix combining social discovery with intent-driven search.
On-demand and specialty retailers continued to shape purchase journeys
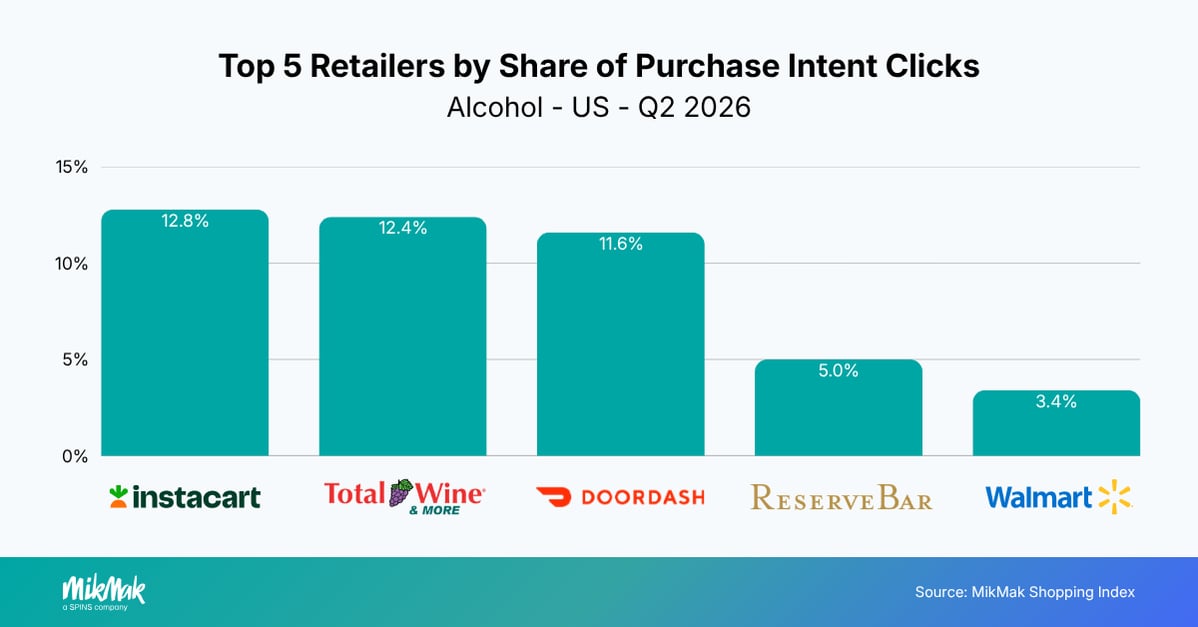
Instacart remained the leading shopping destination despite its share declining from 17.0% in Q2 2025 to 12.8% in Q2 2026. Total Wine & More increased substantially from 8.0% to 12.4%, while DoorDash also strengthened its position from 6.1% to 11.6% year over year. ReserveBar remained among the top destinations, reinforcing continued demand for premium and specialty Alcohol purchases.
Canada
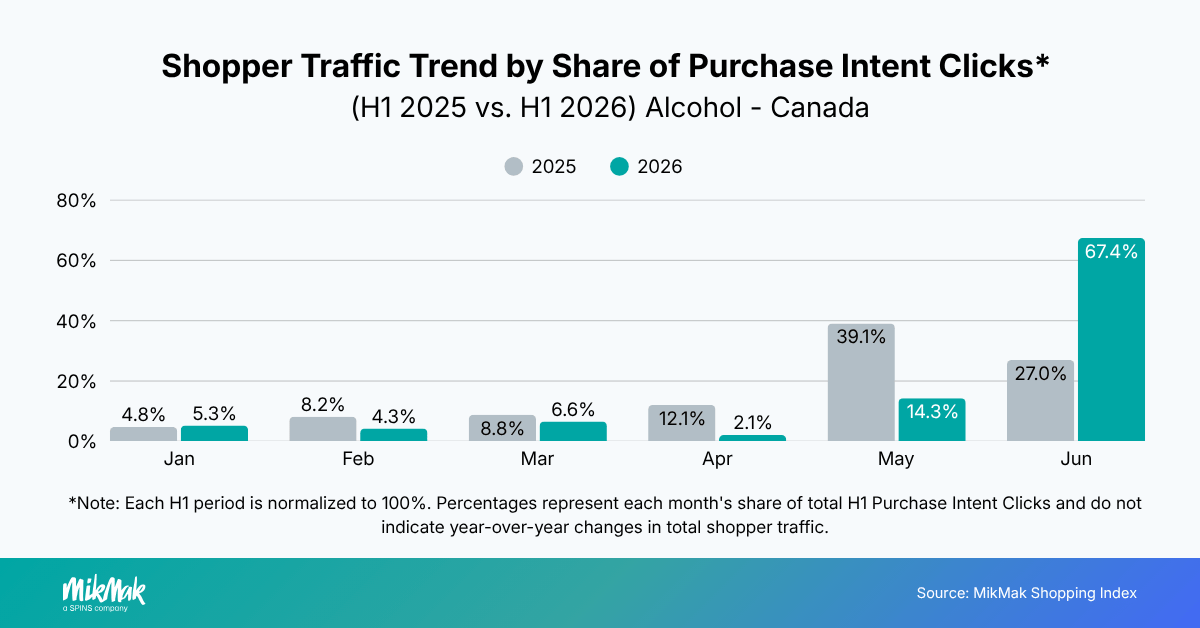
Compared with H1 2025, Canadian Alcohol shopper traffic became more concentrated toward the end of H1 2026. June accounted for 67.4% of H1 Purchase Intent Clicks in 2026, compared with 27.0% in 2025, marking a pronounced shift in engagement toward the final month of the period.
Conversion likelihood improved across owned and media experiences
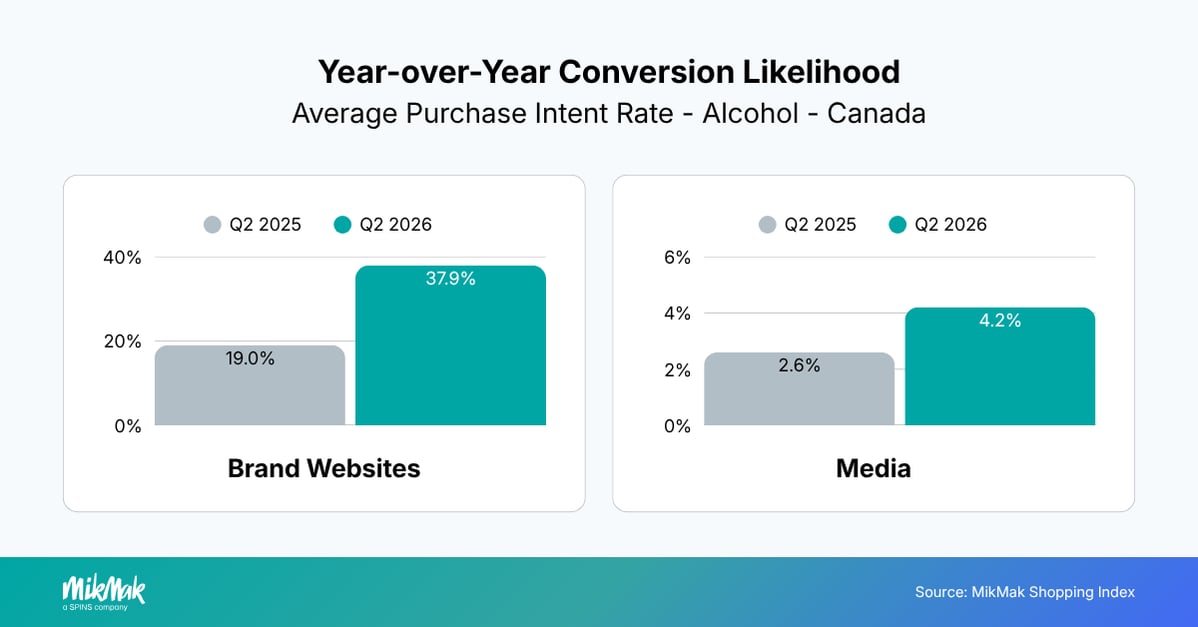
Brand website Purchase Intent Rates nearly doubled year over year, increasing from 19.0% to 37.9%, while media Purchase Intent Rates also improved from 2.6% to 4.2%. The results indicate that Alcohol brands in Canada generated stronger purchase intent across both owned experiences and commerce-enabled media during Q2 2026.
Paid social strengthened its dominance
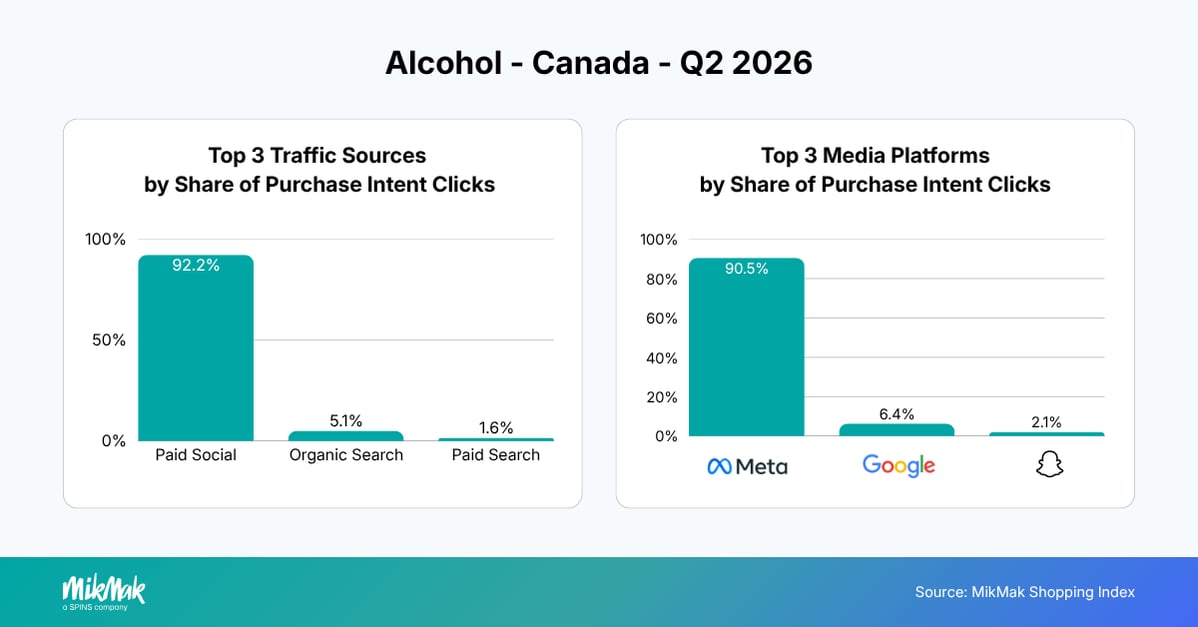
Compared to Q2 2025, paid social increased its share of Purchase Intent Clicks significantly from 60.6% to 92.2%, while organic search declined from 14.1% to 5.1%. The platform mix mirrored this trend, with Meta expanding its share from 55.6% to 90.5% while Google declined from 25.7% to 6.4%.
Provincial retailers continued to dominate purchase destinations
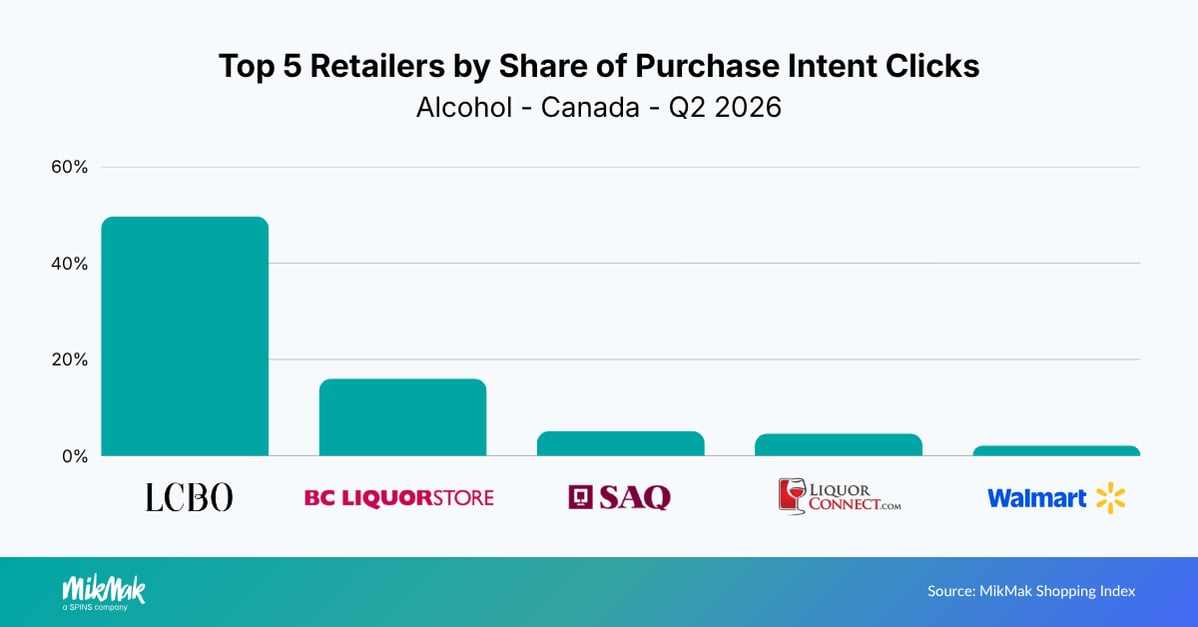
Compared to Q2 2025, LCBO significantly strengthened its leadership, increasing from 30.2% to 49.7% of Purchase Intent Clicks in Q2 2026. BC Liquor Stores entered the top two purchase destinations, while Liquor Connect replaced Instacart Canada among the top five. Overall, the results reinforce the importance of provincial Alcohol retailers alongside emerging fulfillment options.
United Kingdom
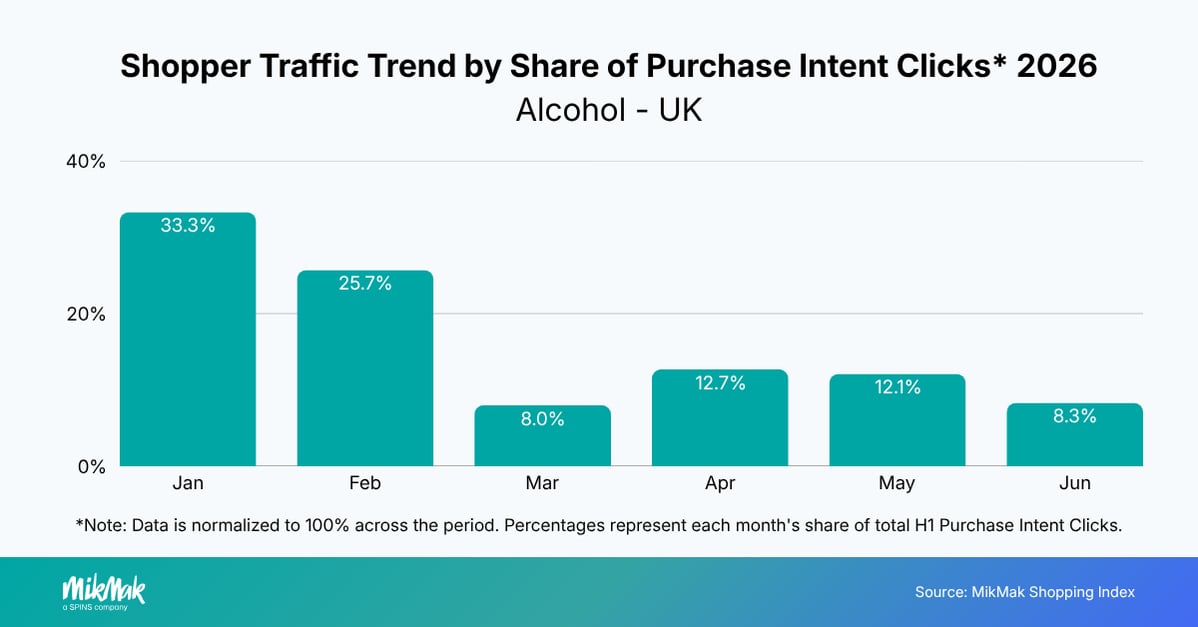
Alcohol shopper engagement was heavily concentrated in the first two months of 2026, with January and February accounting for nearly 60% of Purchase Intent Clicks. Engagement dropped significantly in March and remained relatively consistent through June, indicating demand normalized following a strong start to the year.
Brand websites continued to deliver exceptionally high conversion
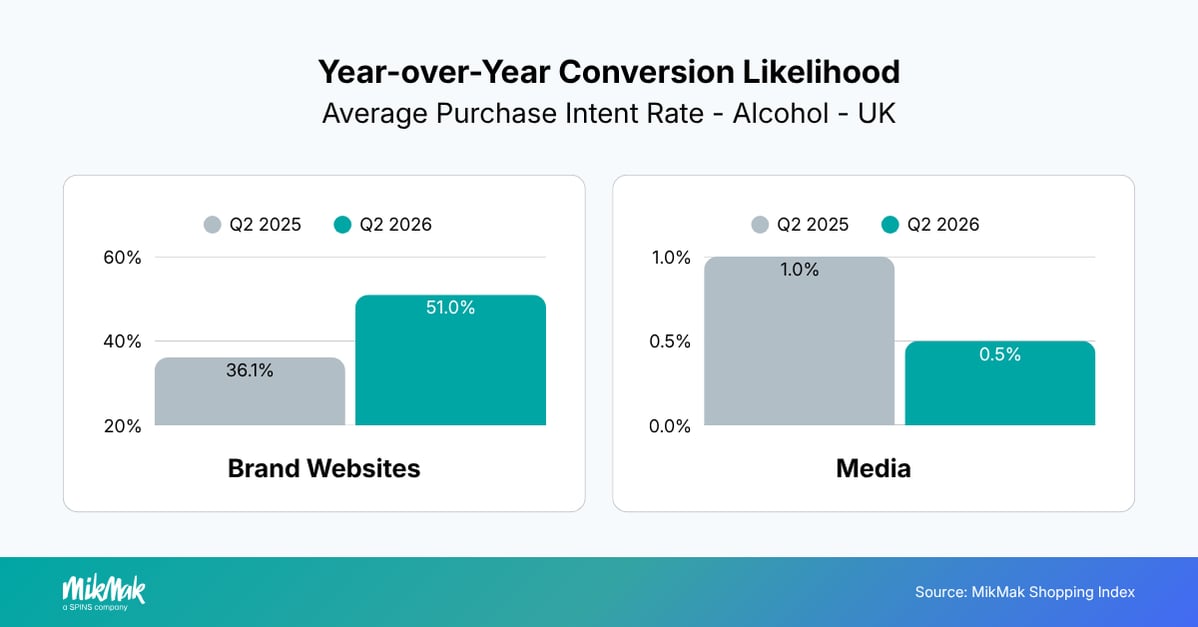
Brand website Purchase Intent Rates increased substantially year over year from 36.1% to 51.0%, highlighting the strong conversion potential of owned digital experiences.
While brand websites delivered strong conversion rates, media Purchase Intent Rates remained low at just 0.5%. The gap highlights an opportunity for Alcohol brands in the UK to strengthen commerce-enabled media experiences and create more effective paths from advertising to purchase destinations.
Search remained the primary shopper traffic driver
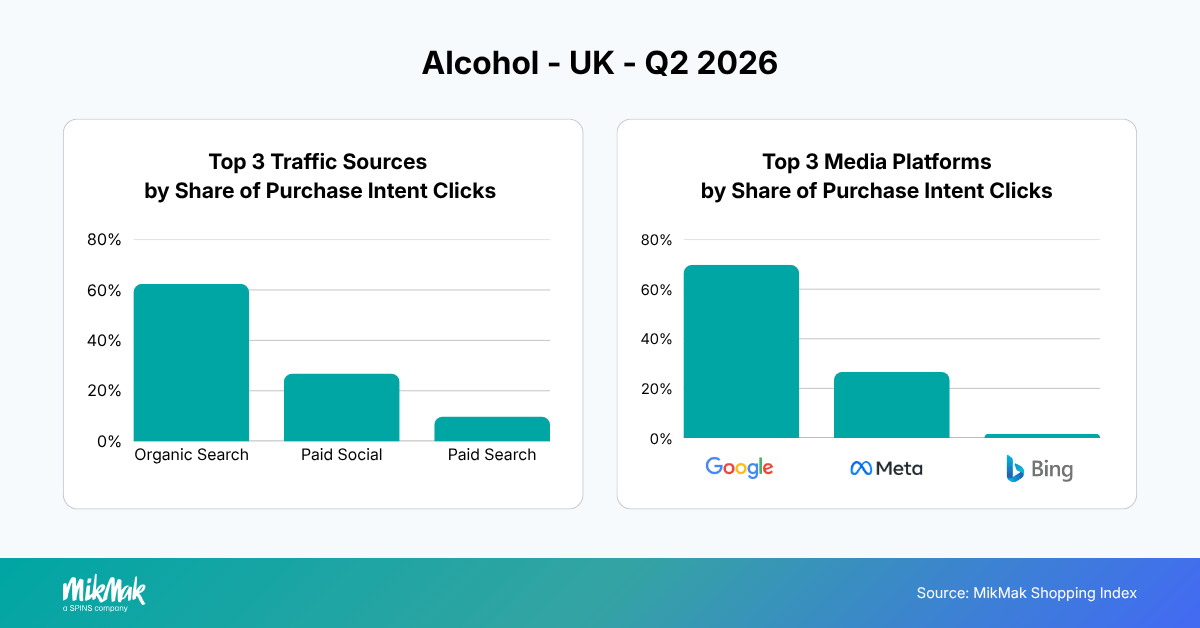
Compared to Q2 2025, organic search remained the leading source of Purchase Intent Clicks, although its share declined from 73.3% to 62.4%. Meanwhile, paid social more than doubled from 11.2% to 26.9%, while paid search increased slightly to 9.8%. While these shifts indicate greater investment in commerce-enabled media, the UK's continued reliance on organic search suggests there is still significant opportunity to drive incremental shopper demand through paid social, search, and other commerce-enabled media.
Google remained the dominant commerce-driving platform despite its share declining from 83.5% to 69.8%, while Meta more than doubled its share from 12.6% to 26.7%. The results point to a more balanced platform mix than a year ago, although search continues to account for the majority of commerce engagement.
Grocery retailers strengthened their position
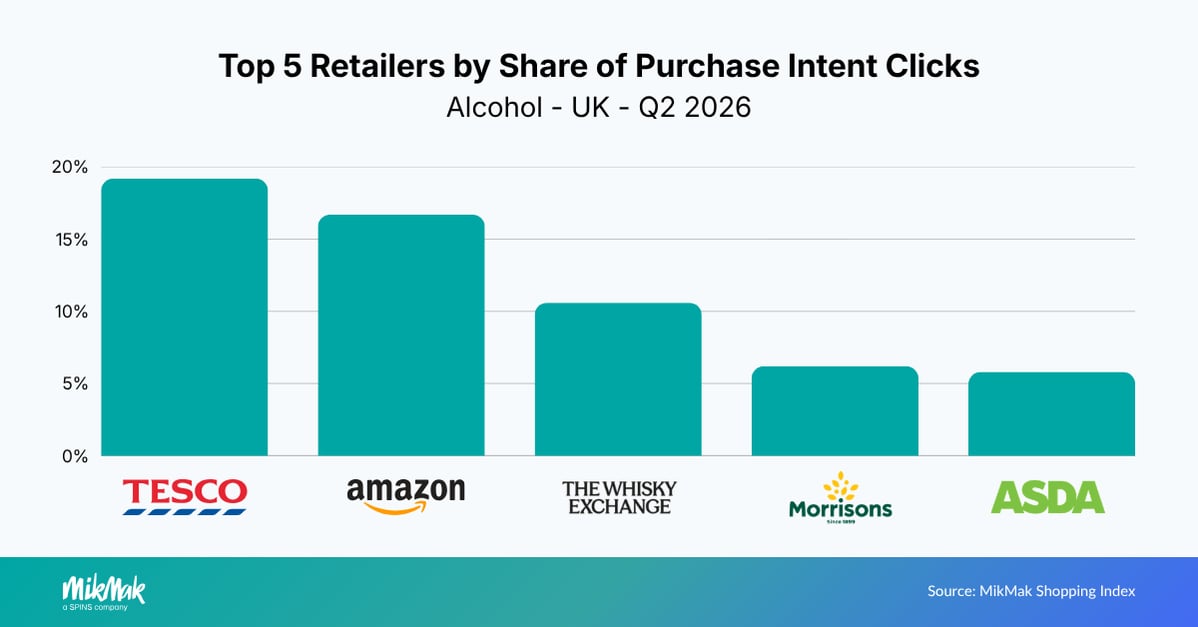
Compared to Q2 2025, Tesco overtook Amazon as the most popular purchase destination, increasing its share from 16.1% to 19.2%, while Amazon declined from 20.3% to 16.7%. The Whisky Exchange also entered the top three shopping choices. Overall, the retailer mix suggests UK Spirits shoppers increasingly balanced specialist retailers and grocery purchasing.
Key Takeaways
- Balance social discovery with search demand capture: While paid social remained the largest driver of shopper traffic in several markets, search continued to gain share as shoppers actively researched products before purchasing. Combining social discovery with intent-driven search helps brands engage consumers throughout the purchase journey while maximizing commerce outcomes.
- Expand commerce beyond brand websites: Brand websites consistently delivered high Purchase Intent Rates, but they represent only one stage of the shopper journey. Commerce-enabled media allows brands to reach significantly larger audiences, capture shoppers who prefer purchasing directly from retailer sites, and measure the impact of media investments on retail sales.
- Build flexible retailer strategies around shopper choice: Alcohol purchase journeys vary by market, with shoppers moving between Grocery retailers, marketplaces, specialty Alcohol retailers, provincial liquor boards, and on-demand delivery services. Maintaining broad retailer coverage ensures brands can capture demand wherever consumers choose to buy while reducing the impact of retailer-specific availability or promotional changes.
Curious to see how MikMak helps brands connect marketing with commerce and unlock first-party shopper data? Schedule a demo today.

*The MikMak Shopping Index was developed to provide a standardized set of metrics, methodology, and benchmarks to help drive brands’ business results and strategy. It is a collection of key eCommerce KPIs collected across hundreds of brands, over 250 channels, and more than 8,000 retailer integrations worldwide to understand consumer online shopping behavior.
Ready to Grow Your Brand in Real-Time?
View All Resources