Quarterly Commerce Marketing Benchmarks for Health and Wellness Brands

Benchmark Overview and KPIs
Health and Wellness brands operate in a highly consideration-driven category, where shoppers balance routine purchases like vitamins and supplements with wellness exploration, product research, and seasonal trends. Understanding how, when, and where shoppers express purchase intent across digital touchpoints is critical to driving conversion and optimizing media performance.
MikMak’s quarterly Health and Wellness commerce marketing benchmarks provide a data-backed view of brand media trends, shopper intent, and retailer engagement, helping brands contextualize performance and refine commerce-enabled activations across owned and paid channels.
This Q2 benchmark analysis is based on MikMak Shopping Index* data from April 1 to June 30, 2026.
The following proprietary MikMak Commerce KPIs were used:
- Purchase Intent Clicks
Measures high-intent shopper traffic by counting the number of times a shopper clicks through to at least one retailer during a single session within MikMak Commerce-enabled brand content. - Purchase Intent Rate
Measures the percentage of shoppers who click through to at least one retailer within MikMak Commerce-enabled brand content, signaling a strong conversion likelihood.
Q2 Key Findings
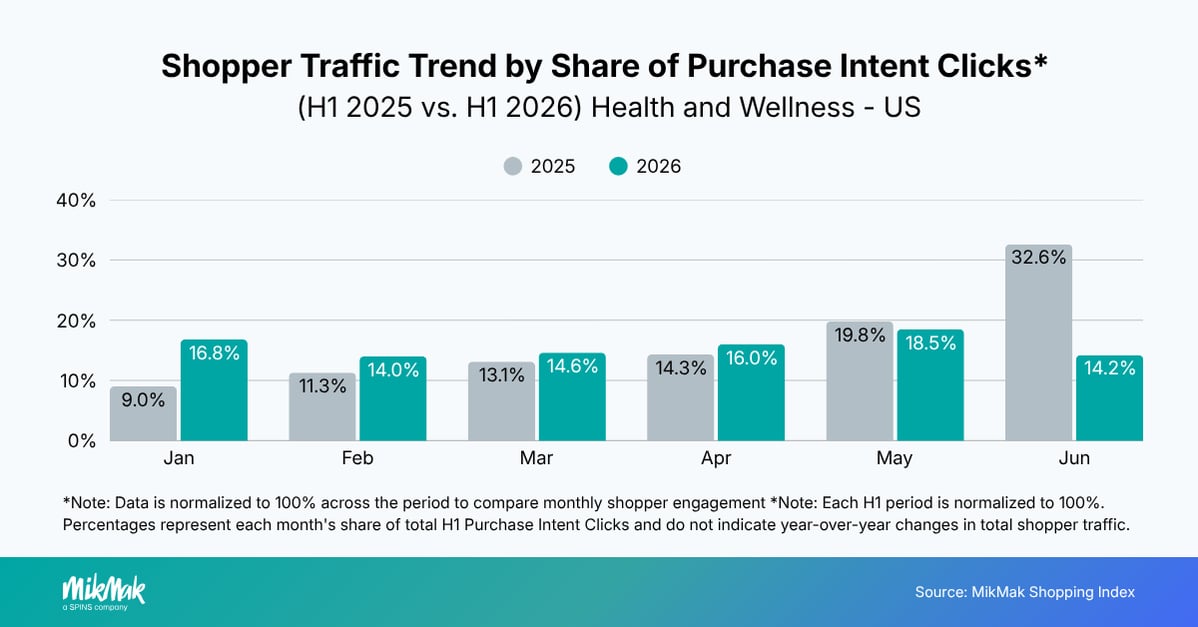
- More consistent shopper engagement across H1: Health and Wellness shopper traffic was more evenly distributed across the first half of 2026 compared to 2025, with brands maintaining shopper engagement more consistently throughout H1.
- Search became an even stronger driver of commerce engagement: Paid search became the leading source of Purchase Intent Clicks in the US, while organic search also gained share year over year. Google strengthened its position as the leading commerce-driving platform, reflecting increased investment in search-led commerce experiences.
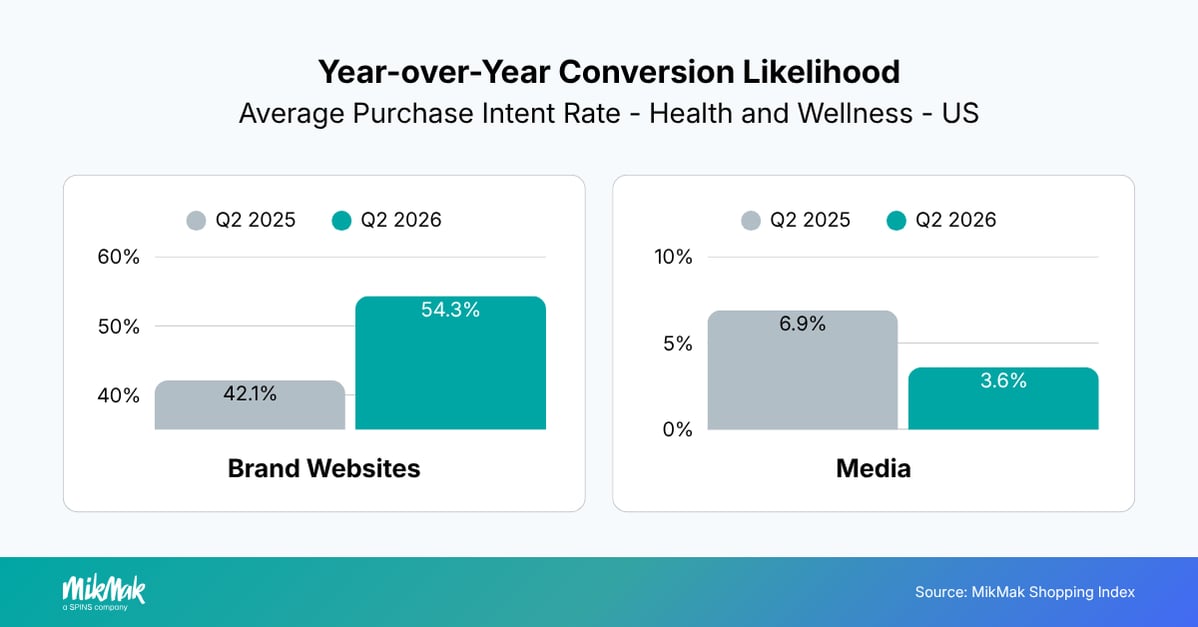
- Commerce performance remained strong across channels: Brand website Purchase Intent Rates exceeded 54% in the US, while commerce-enabled media continued to capture shopper intent earlier in the purchase journey, reinforcing the value of enabling commerce across both owned and paid experiences.
United States
Health and Wellness shopper traffic was more evenly distributed across H1 2026 than in H1 2025. In 2025, engagement built steadily toward June, which accounted for 32.6% of H1 Purchase Intent Clicks. In 2026, no single month represented more than 18.5% of activity, indicating more sustained shopper engagement throughout the first half of the year.
Conversion trends diverged across channels
Brand website Purchase Intent Rates increased from 42.1% to 54.3% in Q2 2026, while media Purchase Intent Rates declined from 6.9% to 3.6%. The widening gap suggests an opportunity to optimize commerce-enabled media experiences to more effectively convert shopper engagement into retailer visits.
Because media typically reaches a broader audience earlier in the purchase journey, it often generates lower Purchase Intent Rates than brand websites. Therefore, while media conversion rates softened, commerce-enabled media continues to play a critical role in capturing shopper intent earlier in the purchase journey and driving incremental retailer traffic.
Search gained momentum as media strategies evolved
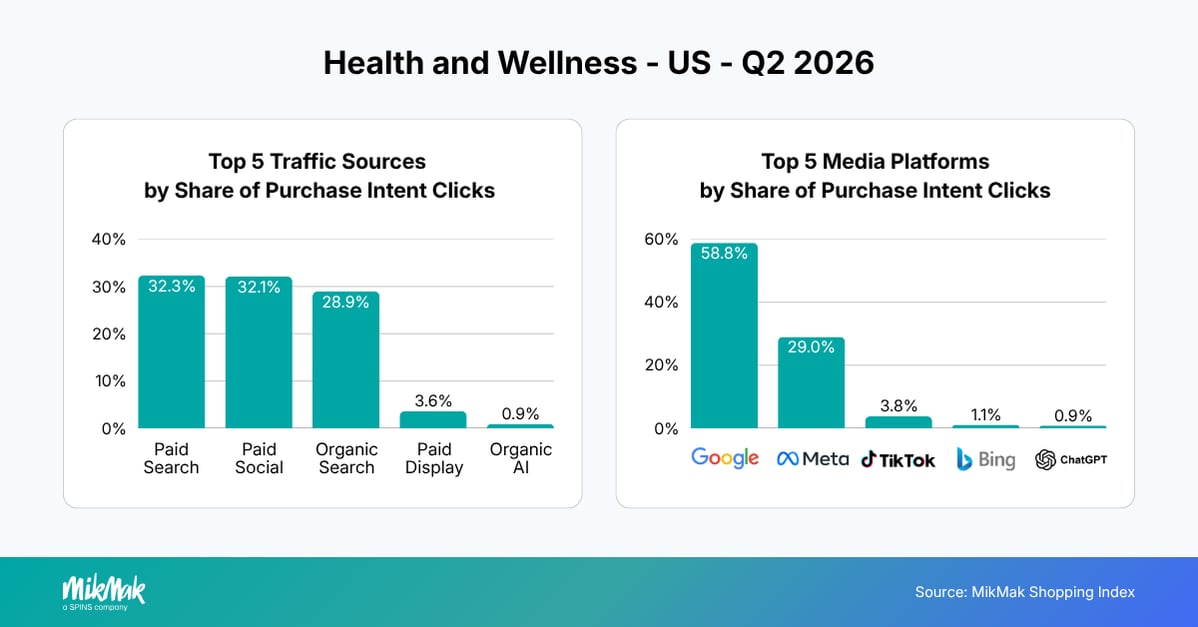
Paid search became the leading source of Purchase Intent Clicks in Q2 2026, increasing its share from 28.5% to 32.3% year over year. Organic search also grew from 24.5% to 28.9%, while paid social declined from 43.3% to 32.1%. This suggests that brands increasingly prioritized search to capture high-intent shoppers while maintaining a substantial investment in social discovery.
Overall, the results suggest Health and Wellness brands shifted more of their media investment toward search to engage high-intent shoppers, while social media continued to play an important role in shopper discovery.
As search became a larger driver of commerce engagement year over year, Google further strengthened its position, increasing its share of Purchase Intent Clicks from 51.1% to 58.8%. Meanwhile, Meta declined from 38.3% to 29.0%, while TikTok increased slightly from 3.5% to 3.8%. Together, these shifts reinforce the growing importance of search-led commerce strategies while highlighting the continued role of social platforms in shopper discovery.
Marketplace leadership remained strong as purchase destination preferences evolved
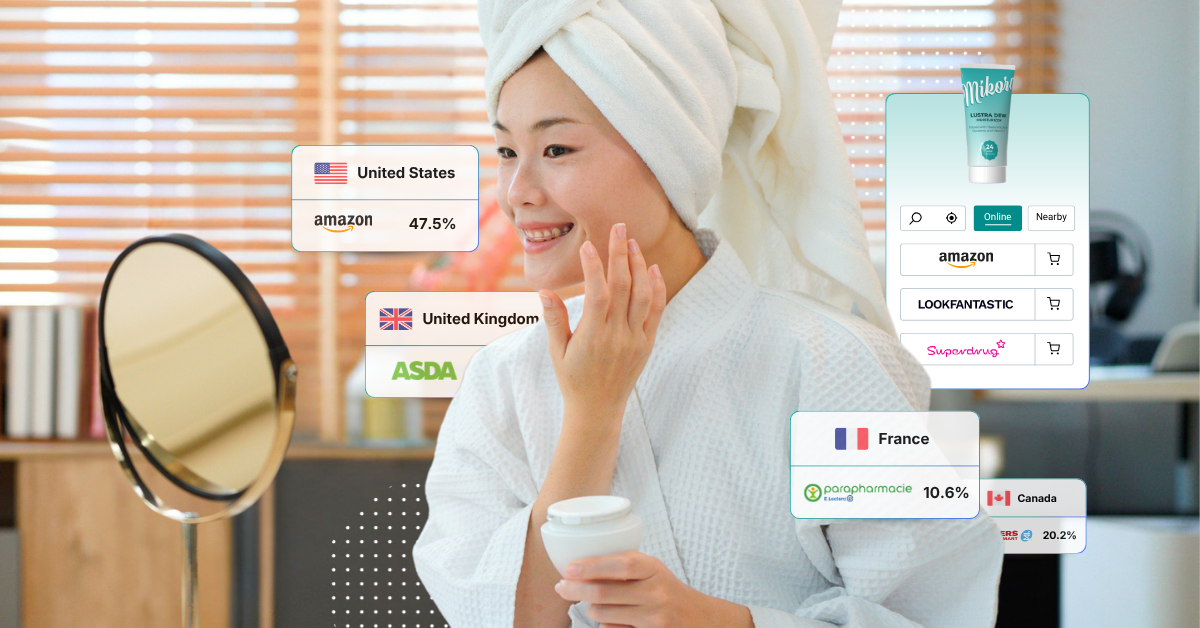
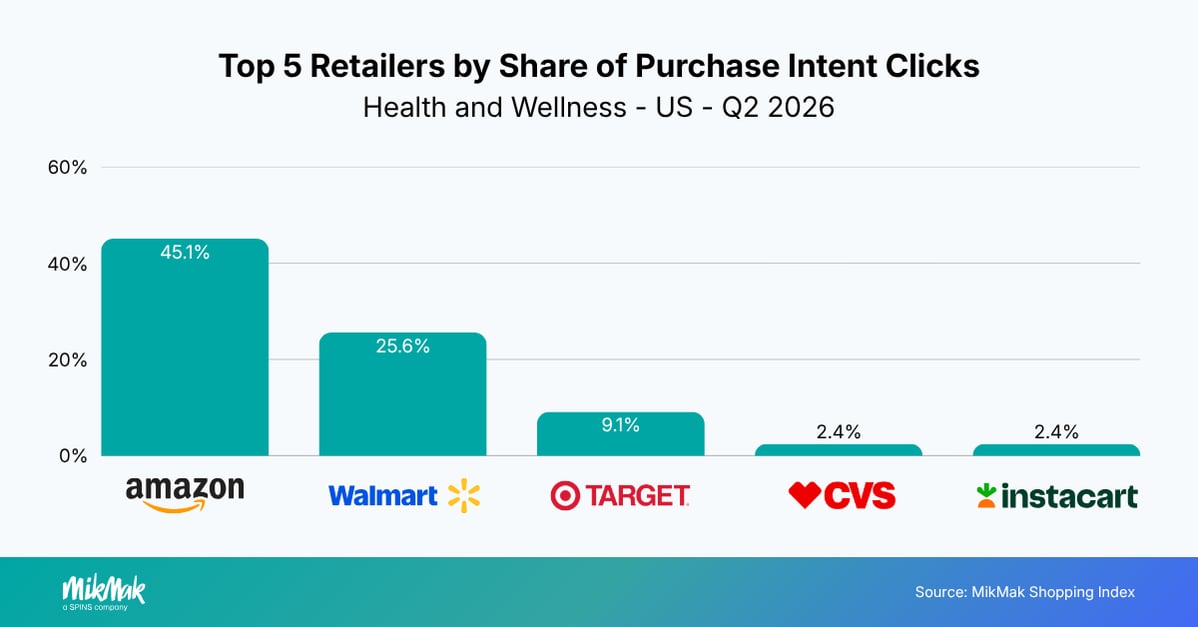
Amazon strengthened its position as the leading purchase destination for Purchase Intent Clicks in Q2 2026, increasing its share from 41.5% to 45.1% year over year. Walmart remained the second-largest destination despite a decline from 31.8% to 25.6%, while Target remained broadly stable.
CVS remained among the top purchase destinations, while Instacart entered the top five, replacing Walgreens. Overall, the results reinforce the importance of maintaining broad retailer coverage across marketplaces, mass retailers, and health-focused commerce destinations.
Key Takeaways
- Balance search leadership with full-funnel media investment: Search continued to strengthen its role in Health and Wellness commerce, with Google increasing its share of Purchase Intent Clicks while paid search overtook paid social as the largest traffic source. At the same time, social platforms remain critical for reaching consumers earlier in their purchase journey. A balanced media strategy helps brands capture both active demand and future shoppers.
- Enable commerce across media, not just owned channels: Brand websites delivered exceptionally high Purchase Intent Rates, but they reach only a fraction of potential shoppers. Commerce-enabled media allows brands to capture consumers who prefer to purchase directly from retailer sites, while providing measurable insights into the impact of media investments on commerce outcomes.
- Maintain a broad retailer strategy to meet shopper preferences: Amazon continued to strengthen its leadership, while Walmart, Target, and Pharmacy retailers remained important purchase destinations. Ensuring seamless commerce experiences across marketplaces, mass retailers, and Health-focused retailers helps brands capture demand wherever shoppers choose to buy.
Curious to see how MikMak helps brands connect marketing with commerce and unlock first-party shopper data? Schedule a demo today.

*The MikMak Shopping Index was developed to provide a standardized set of metrics, methodology, and benchmarks to help drive brands’ business results and strategy. It is a collection of key eCommerce KPIs collected across hundreds of brands, over 250 channels, and more than 8,000 retailer integrations worldwide to understand consumer online shopping behavior.