Quarterly Commerce Marketing Benchmarks for Pet Care Brands
Benchmark Overview and KPIs
Pet Care brands operate in a consideration-driven, replenishment-heavy category, where shoppers balance routine purchases with research around health, nutrition, and specialty needs. As shoppers move between media, search, brand websites, and retailer destinations, understanding where purchase intent develops is essential for capturing demand.
MikMak’s quarterly Pet Care commerce marketing benchmarks provide a data-backed view of brand media trends, shopper intent, and retailer engagement, helping brands contextualize performance and refine commerce-enabled activations across owned and paid channels.
This Q2 benchmark analysis is based on MikMak Shopping Index* data from April 1 to June 30, 2026.
The following proprietary MikMak Commerce KPIs were used:
- Purchase Intent Clicks
Measures high-intent shopper traffic by counting the number of times a shopper clicks through to at least one retailer during a single session within MikMak Commerce-enabled brand content. - Purchase Intent Rate
Measures the percentage of shoppers who click through to at least one retailer within MikMak Commerce-enabled brand content, signaling a strong conversion likelihood.
Q2 Key Findings
- Consistent shopper demand through Q2: Following a strong peak in March, shopper engagement remained remarkably stable throughout the second quarter, demonstrating steady purchasing behavior as consumers continued to replenish everyday pet essentials.
- Search remained the dominant commerce driver: Paid search generated more than 70% of Purchase Intent Clicks, reinforcing that Pet Care shoppers are highly intent-driven. Google and Bing continued to dominate platform performance, suggesting brands concentrated commerce investment around search throughout the purchase journey.
- Commerce performance remained strong across channels: Brand websites maintained exceptionally high Purchase Intent Rates of more than 50%, while media Purchase Intent Rates continued to improve quarter over quarter. Together, these results highlight the value of combining high-converting owned experiences with commerce-enabled media to capture demand throughout the shopper journey.
United States
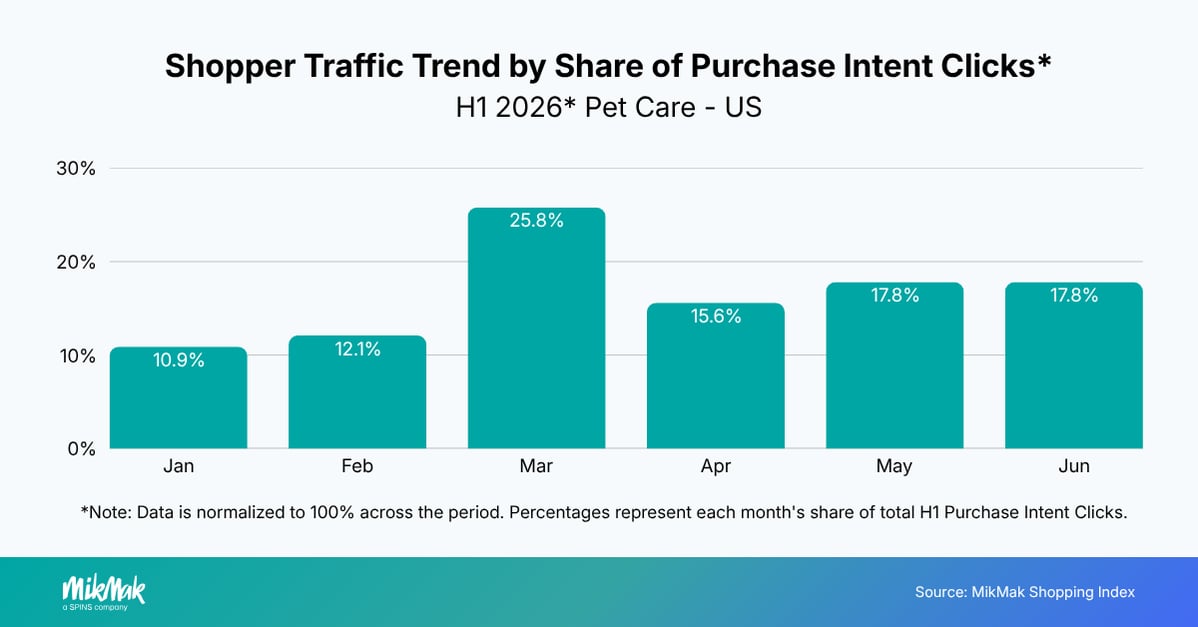
Shopper engagement peaked in March, which accounted for 25.8% of H1 Purchase Intent Clicks. Activity was more evenly distributed throughout Q2, with April, May, and June contributing 15.6%, 17.8%, and 17.8% of H1 traffic, respectively. This pattern indicates that Pet Care shopper engagement remained steady following the March peak.
Conversion performance remained strong across owned and paid channels
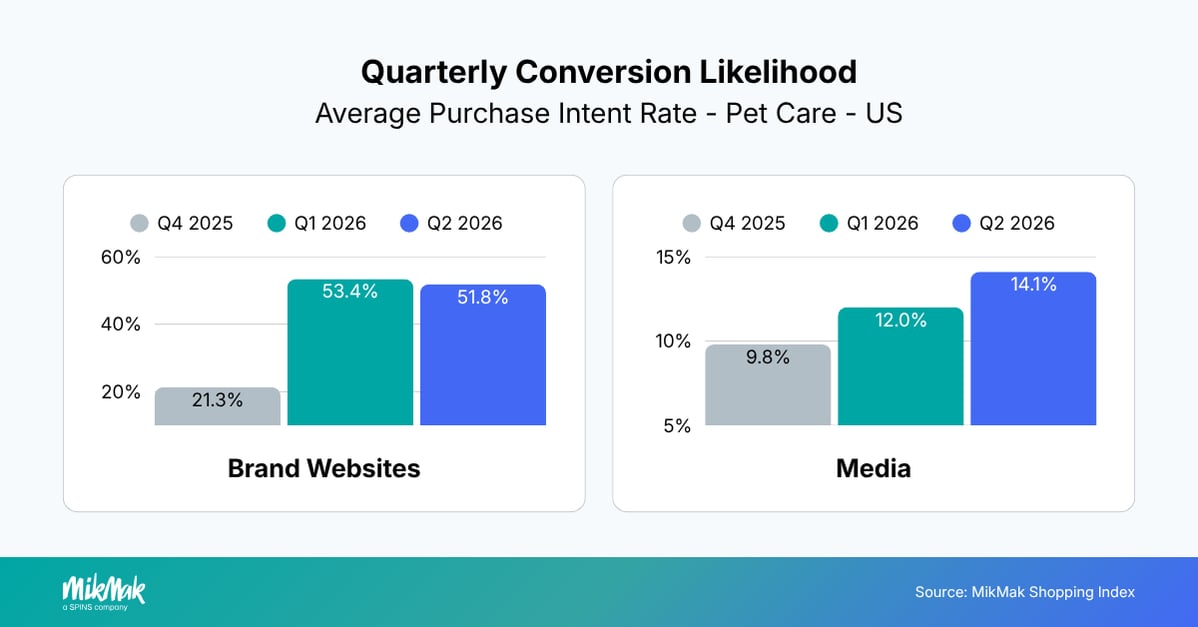
Purchase Intent Rates remained high across both owned experiences and commerce-enabled media in Q2 2026. Brand website Purchase Intent Rates eased only slightly from 53.4% to 51.8%, while media Purchase Intent Rates increased from 12.0% to 14.1%.
The improvement in media Purchase Intent Rates suggests commerce-enabled campaigns became even more effective at generating purchase intent, while brand websites continued to serve as exceptionally strong conversion destinations.
Paid search continued to dominate commerce engagement
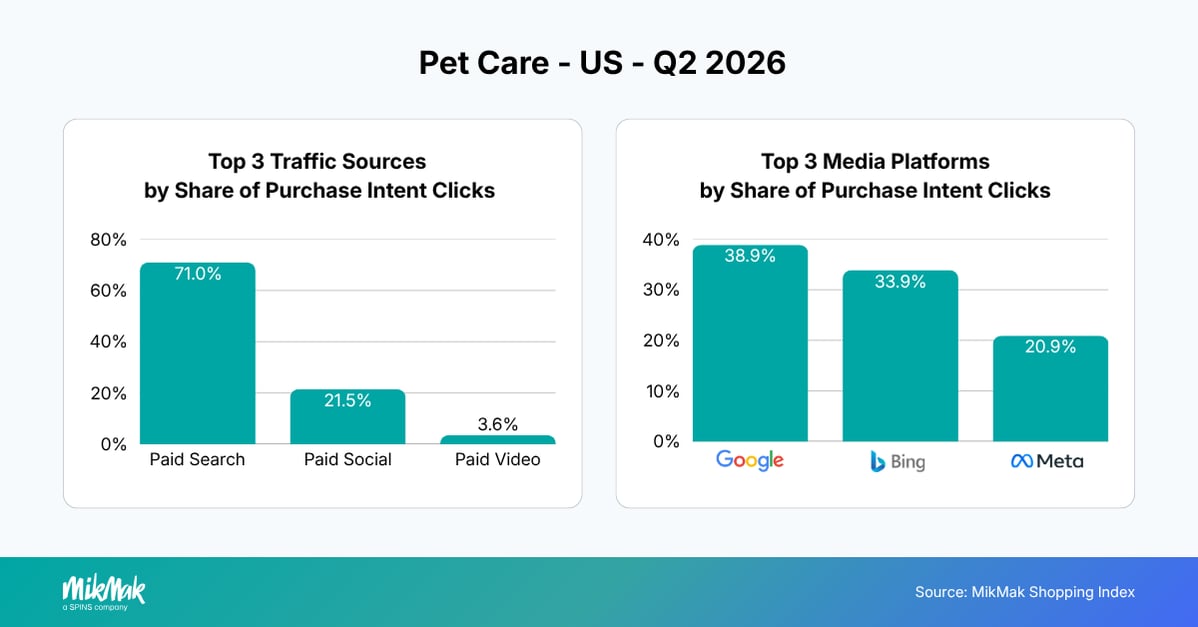
Compared to Q2 2025, paid search remained the leading source of Purchase Intent Clicks in Q2 2026, increasing slightly from 70.2% to 71.0%. Paid social also grew modestly from 20.1% to 21.5%, while paid video declined from 4.9% to 3.6%.
As search remained the dominant source of shopper engagement, Google and Bing continued to account for the majority of platform-driven Purchase Intent Clicks. While Google's share declined from 48.0% to 38.9%, Bing increased significantly from 24.8% to 33.9%, and Meta also gained modestly. Together, these results suggest brands maintained a strong focus on search while modestly diversifying commerce investment across search engines and social platforms.
Specialist retailers maintained their leadership
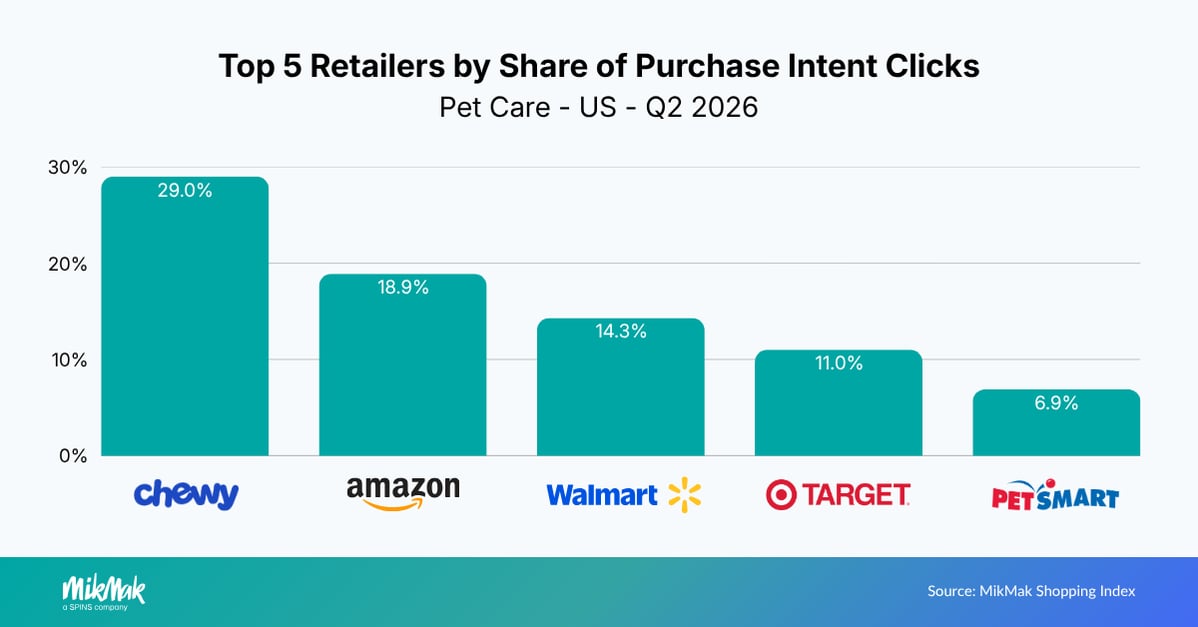
Compared to Q2 2025, Chewy remained the most popular retailer destination based on Purchase Intent Clicks, although its share declined from 34.2% to 29.0%. Amazon (20.9% to 18.9%) and Walmart (19.7% to 14.3%) also saw lower shares, while Target nearly doubled its share from 5.9% to 11.0% and PetSmart increased from 5.0% to 6.9%.
Overall, the retailer mix became more balanced, suggesting Pet Care shoppers increasingly spread purchases across specialist retailers and mass merchants. These shifts reinforce the importance of broad retailer coverage to capture demand wherever shoppers choose to buy.
Key Takeaways
- Maintain a balanced commerce marketing strategy: Paid search generated more than 70% of Purchase Intent Clicks, making search the primary driver of Pet Care commerce. At the same time, maintaining commerce-enabled social and display experiences helps brands influence shoppers throughout the purchase journey rather than relying on a single channel.
- Balance owned experiences with commerce-enabled media: Brand websites continued to deliver exceptionally high Purchase Intent Rates of more than 50%, while media Purchase Intent Rates improved quarter over quarter. Combining high-converting owned experiences with commerce-enabled media helps brands drive both immediate sales and measurable shopper engagement across the purchase journey.
- Continuously optimize commerce performance using real-time insights: Shopper demand, media efficiency, and retailer preferences can shift from quarter to quarter. Monitoring commerce performance in real time enables brands to adapt media investment, optimize retailer activation, and respond quickly to changing shopper behavior.
Curious to see how MikMak helps brands connect marketing with commerce and unlock first-party shopper data? Schedule a demo today.

*The MikMak Shopping Index was developed to provide a standardized set of metrics, methodology, and benchmarks to help drive brands’ business results and strategy. It is a collection of key eCommerce KPIs collected across hundreds of brands, over 250 channels, and more than 8,000 retailer integrations worldwide to understand consumer online shopping behavior.
Ready to Grow Your Brand in Real-Time?
View All Resources