Quarterly Commerce Marketing Benchmarks for Consumer Electronics and Home Appliance Brands
Benchmark Overview and KPIs
Consumer Electronics and Home Appliance purchases typically involve longer consideration cycles than many FMCG categories. Shoppers often compare specifications, reviews, prices, and retailers before making a purchase, moving repeatedly between search engines, brand websites, commerce-enabled media, and retail destinations throughout their buying journey.
MikMak's quarterly Consumer Electronics and Home Appliance commerce marketing benchmarks provide brands with a data-driven view of shopper discovery trends, media performance, and purchase intent across global markets, helping brands contextualize performance and refine commerce-enabled activations across owned and paid channels.
This Q2 benchmark analysis is based on MikMak Shopping Index* data from April 1 to June 30, 2026.
The following proprietary MikMak Commerce KPIs were used:
- Purchase Intent Clicks
Measures high-intent shopper traffic by counting the number of times a shopper clicks through to at least one retailer during a single session within MikMak Commerce-enabled brand content. - Purchase Intent Rate
Measures the percentage of shoppers who click through to at least one retailer within MikMak Commerce-enabled brand content, signaling a strong conversion likelihood.
Q2 Key Findings
- Search dominated commerce engagement across most markets. Germany, the UK, Spain, the Netherlands, Australia, and Canada all relied primarily on organic and/or paid search to drive Purchase Intent Clicks, highlighting the importance of capturing high-intent shoppers actively researching Consumer Electronics and Home Appliance purchases.
- The US maintained a more balanced media mix. Paid social remained the largest driver of shopper traffic in the United States, while search continued to account for a substantial share of Purchase Intent Clicks. This highlights a more diversified commerce strategy that combines discovery-led social campaigns with intent-driven search.
- Google remained the dominant commerce platform globally. Google was the leading media platform across every market analyzed, reinforcing the central role of search throughout the Consumer Electronics and Home Appliance purchase journey. Meta maintained a strong position in markets such as the US, while Bing also generated meaningful shopper traffic in several countries, particularly Canada, Germany, and the UK.
United States
Shopper demand accelerated toward summer
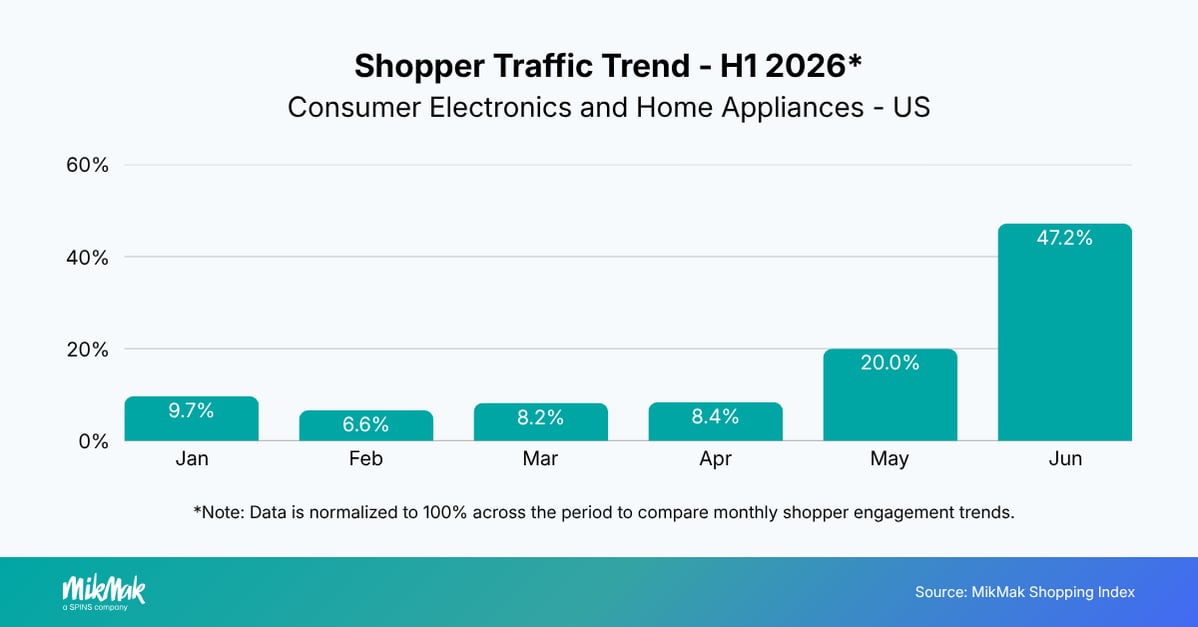
Shopper engagement built steadily throughout Q2, culminating in a significant spike in June, which accounted for nearly half of all H1 Purchase Intent Clicks. This suggests that late-quarter promotional activity and summer purchasing cycles drove the strongest shopper demand.
Social continues to lead while search captures high-intent shoppers
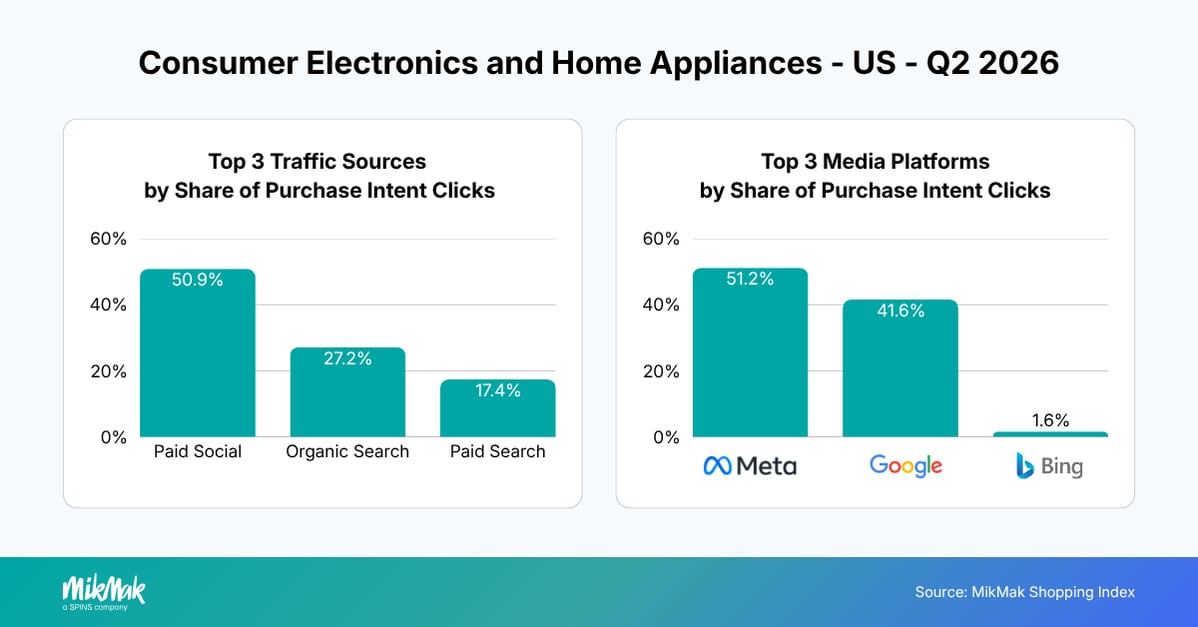
Paid social generated 50.9% of Purchase Intent Clicks, remaining the largest source of shopper traffic. Organic search (27.2%) and paid search (17.4%) together accounted for nearly half of Purchase Intent Clicks, highlighting the important role of active product research before purchase. At the platform level, Meta beat out Google by 10 points (51.2% vs. 41.6%).
Canada
Shopper activity strengthened throughout Q2
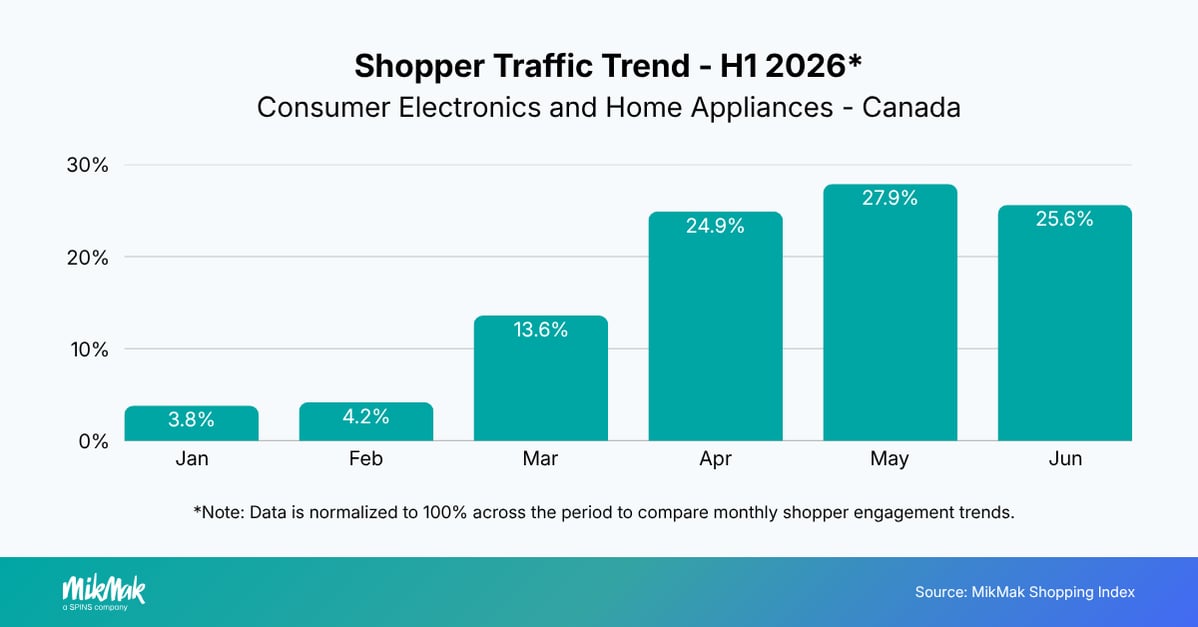
Canadian shopper engagement increased steadily during the quarter, with April, May and June accounting for nearly 80% of H1 Purchase Intent Clicks. This indicates sustained demand heading into the summer purchasing season.
Search dominated the purchase journey
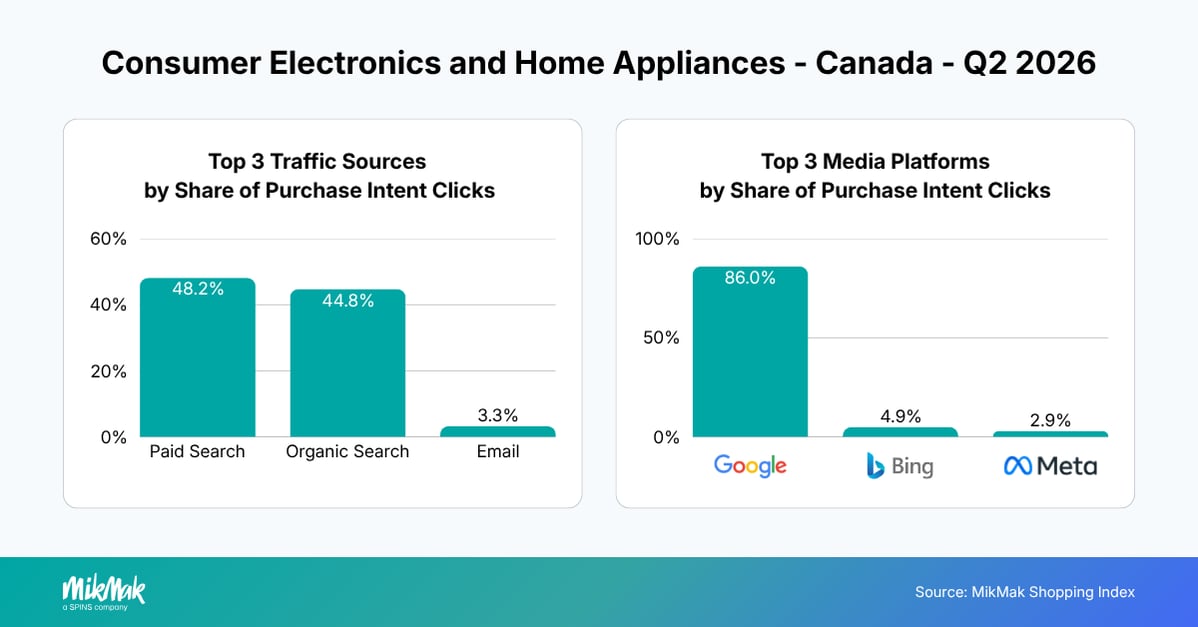
Canada exhibited one of the strongest search-driven commerce patterns this quarter. Paid search (48.2%) narrowly exceeded organic search (44.8%), with the two channels together accounting for more than 90% of Purchase Intent Clicks. This suggests that brand investment remained heavily concentrated on search, helping capture shoppers actively researching Consumer Electronics and Home Appliance purchases.
As search accounted for more than 90% of Purchase Intent Clicks, Google naturally dominated platform performance, generating 86.0% of platform-driven Purchase Intent Clicks. Although paid social represented just 2.7% of shopper traffic, Meta remained the third-largest platform, indicating social continued to support product discovery despite relatively limited investment.
Australia
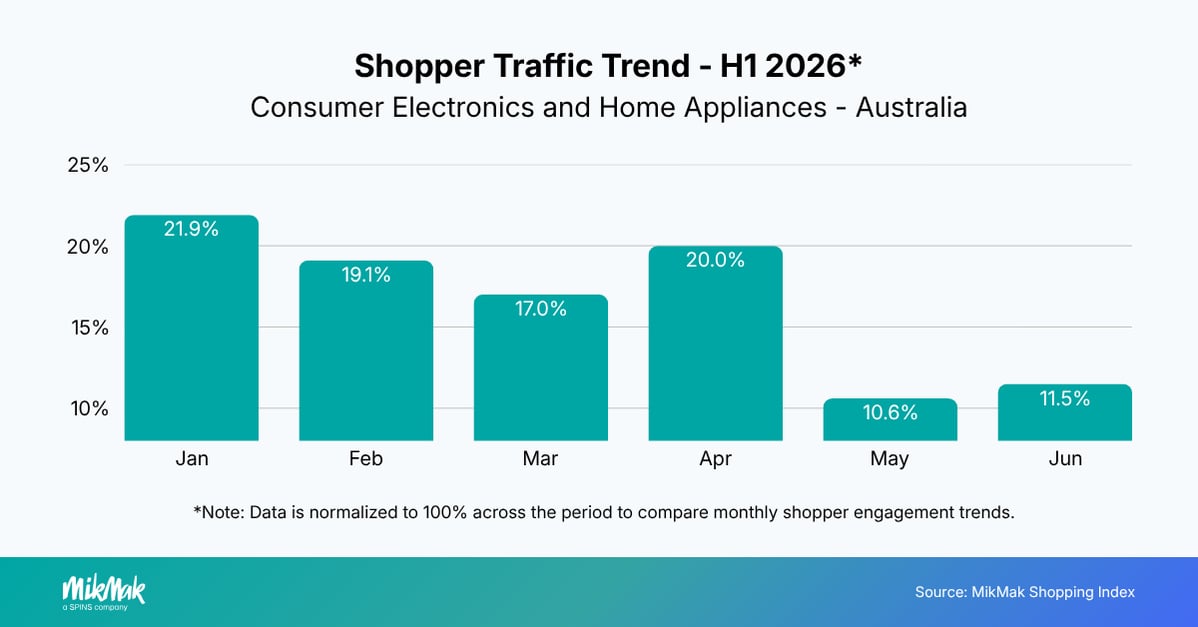
Shopper engagement was strongest from January through April
Shopper engagement remained relatively consistent from January through April before declining in May and June. The pattern may reflect market-specific seasonality as Australia transitioned from summer into winter.
Search lead discovery with social providing incremental reach
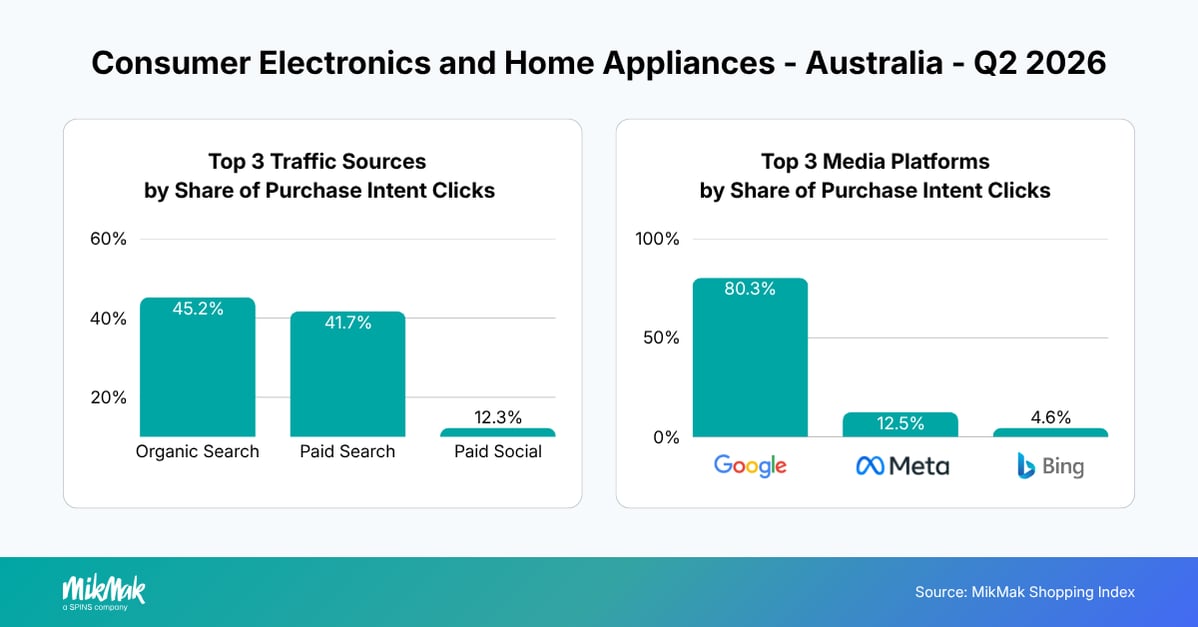
Organic search (45.2%) narrowly outperformed paid search (41.7%), with paid social contributing an additional 12.3% of Purchase Intent Clicks. Together, search channels generated nearly 87% of shopper traffic, suggesting that Consumer Electronics and Home Appliance brands in Australia are investing across both paid and organic search to capture shoppers actively researching products.
Google dominated platform performance with an 80.3% share of Purchase Intent Clicks, while Meta remained the leading social platform at 12.5%. The continued role of paid social indicates that brands are also using social channels to drive awareness and incremental shopper discovery before consumers transition to search as they move closer to purchase.
United Kingdom
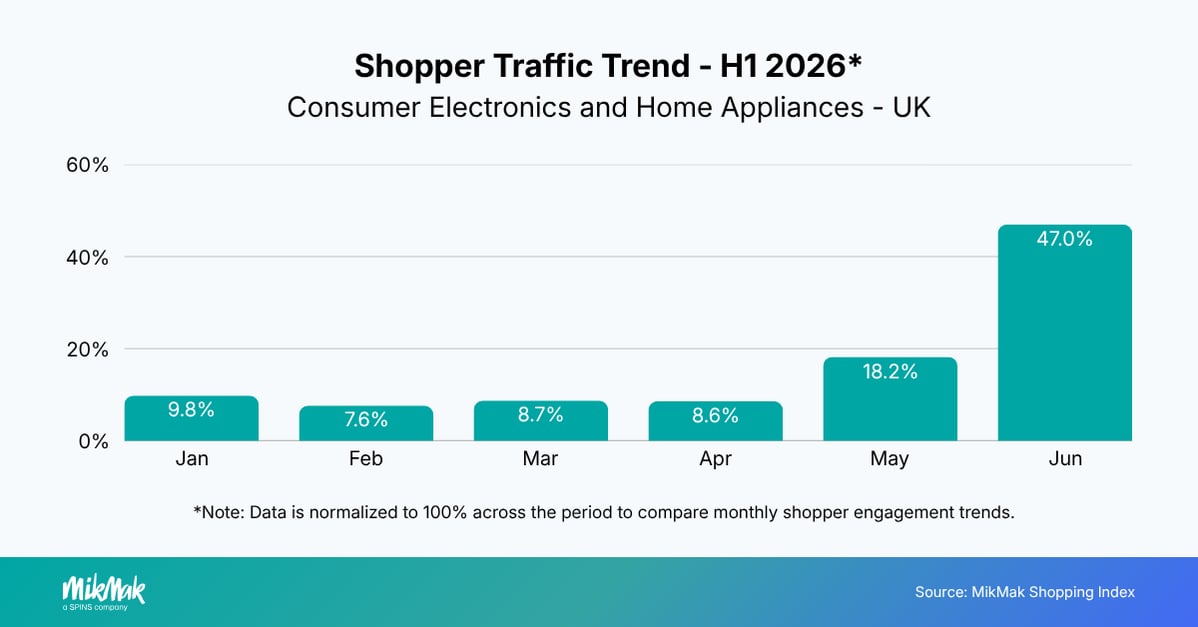
Shopper engagement peaked in June
Shopper demand for Consumer Electronics and Home Appliances accelerated sharply during Q2, with June accounting for nearly half of all H1 Purchase Intent Clicks. This indicates strong late-quarter purchase activity, likely driven by seasonal promotions.
Strong organic visibility, untapped paid media potential
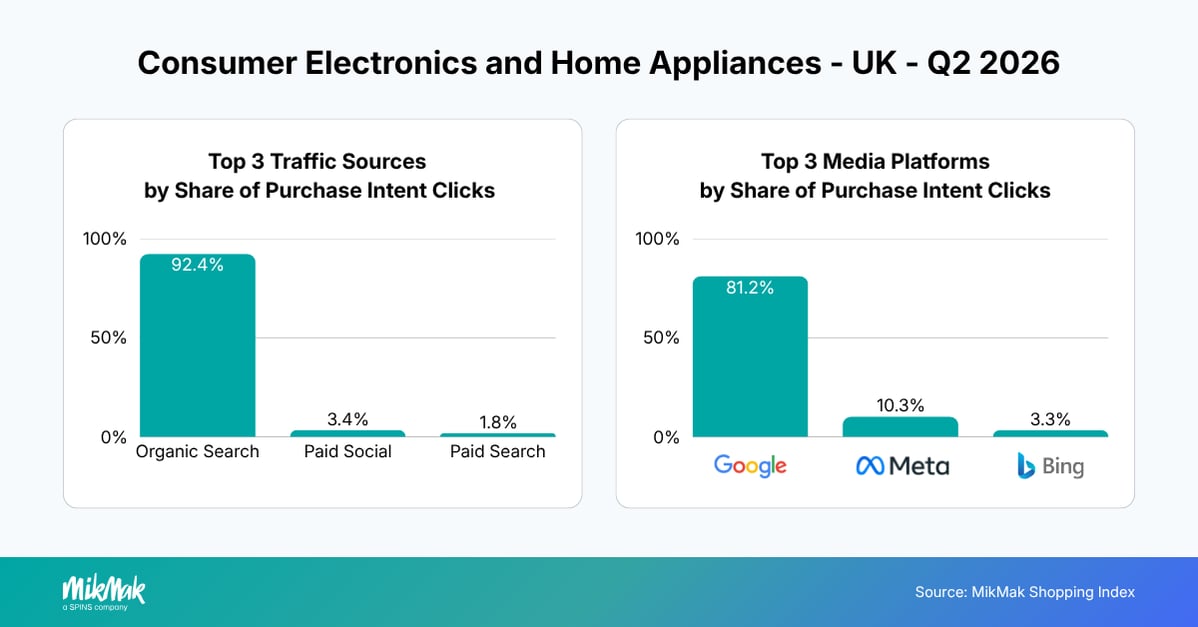
Organic search generated 92.4% of Purchase Intent Clicks, making the UK one of the most search-driven markets analyzed. Paid social (3.4%) and paid search (1.8%) played comparatively small roles in driving shopper traffic, suggesting that many brands are currently relying on existing consumer demand rather than actively generating incremental commerce opportunities through paid media.
Google accounted for more than four-fifths of all platform traffic, while Meta remained a distant second. While maintaining strong organic search visibility remains essential, the data suggests a significant opportunity to expand commerce-enabled paid search, social, and display activations to capture shoppers earlier in the purchase journey and generate incremental retailer demand.
Germany
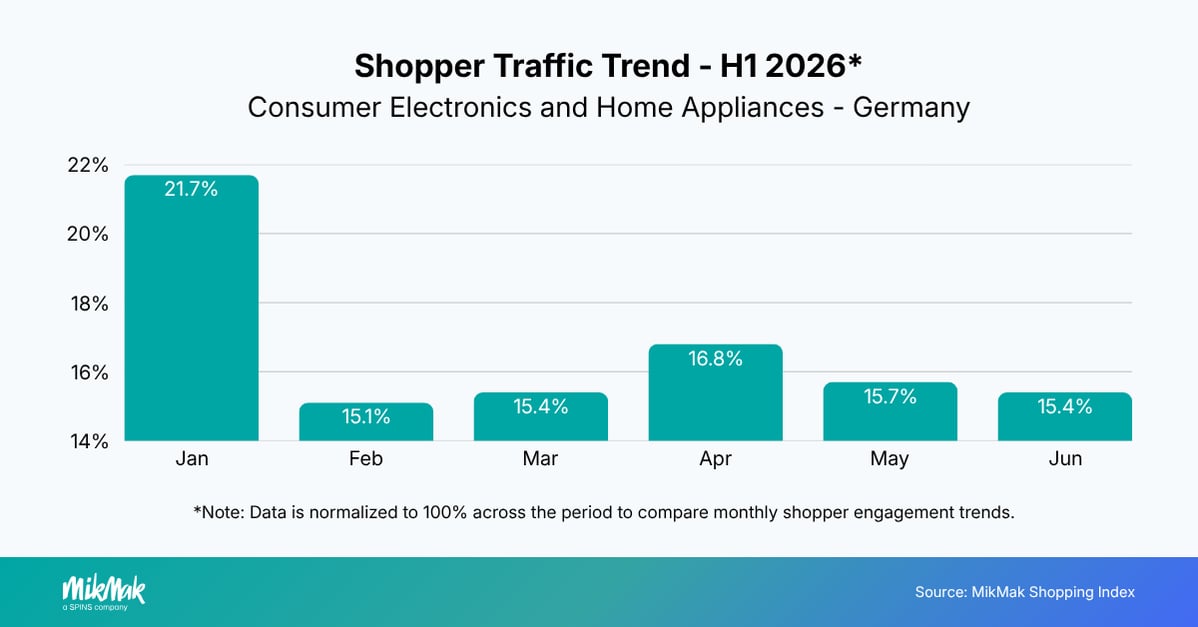
Shopper demand remained relatively stable across H1
German shopper engagement remained relatively consistent throughout the first half of the year. While January accounted for the largest share of H1 Purchase Intent Clicks (21.7%), shopper activity remained steady across the remaining months, each contributing between 15% and 17% of total traffic.
Search dominated commerce engagement
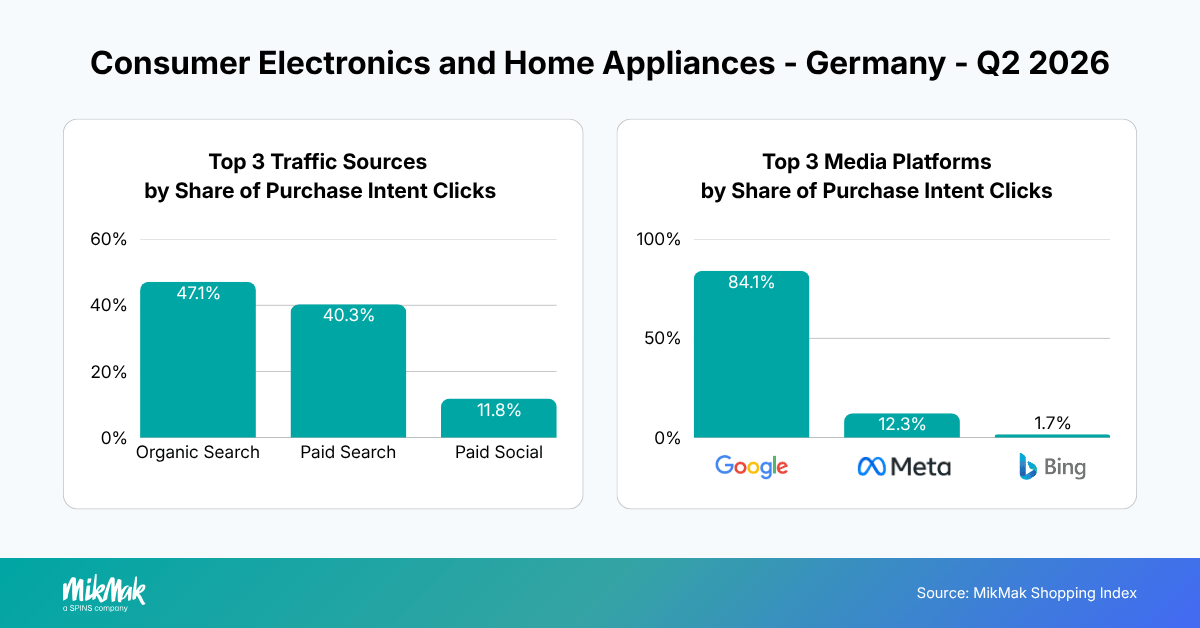
Organic search (47.1%) and paid search (40.3%) together generated almost 90% of Purchase Intent Clicks, highlighting both strong consumer reliance on active product research and continued brand investment in search as a key commerce channel.
Paid social accounted for 11.8% of shopper traffic, demonstrating that while search remains the primary driver of purchase intent, social continues to create incremental discovery opportunities. Google dominated media platforms with an 84.1% share of Purchase Intent Clicks.
Netherlands
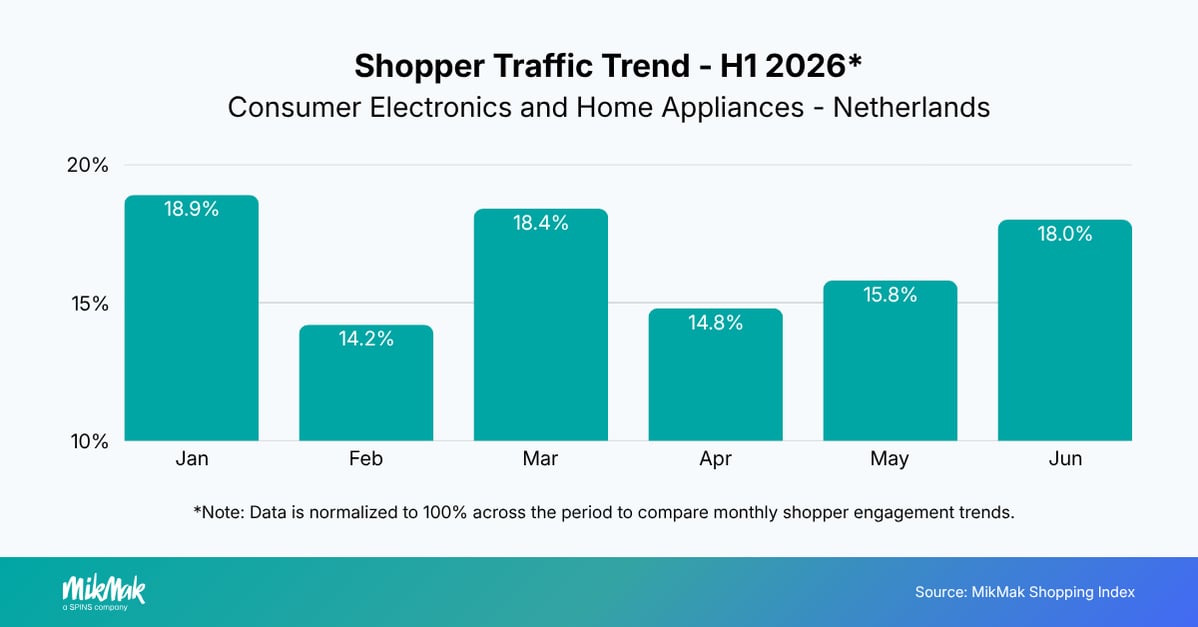
Shopper demand remained evenly distributed
Unlike markets with pronounced promotional peaks, shopper activity in the Netherlands stayed relatively balanced throughout H1, indicating consistent purchase behavior.
Search dominated while social remains underutilized
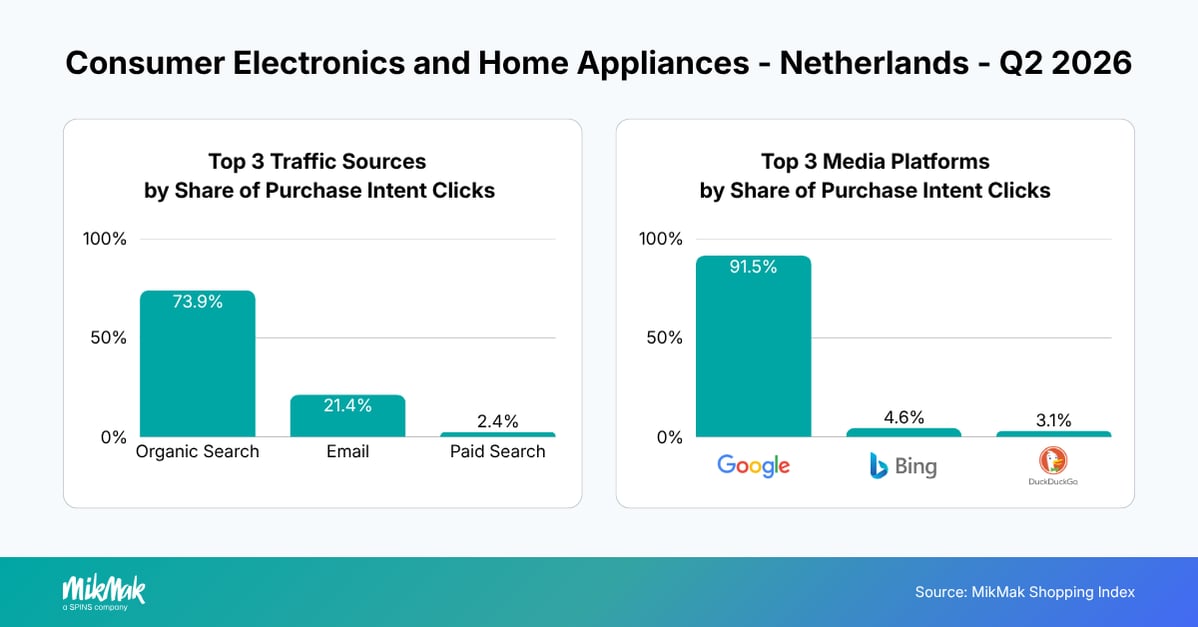
Organic search generated 73.9% of Purchase Intent Clicks, while email contributed an unusually large 21.4% share. Paid search accounted for just 2.4%, and paid social represented only 0.5%.
As search remained the primary driver of commerce engagement, Google generated more than 90% of platform-driven Purchase Intent Clicks. The limited role of paid media suggests brands may have opportunities to expand commerce-enabled search and social investment to generate incremental shopper demand beyond existing organic traffic.
Spain
Shopper activity strengthened at the beginning and end of H1
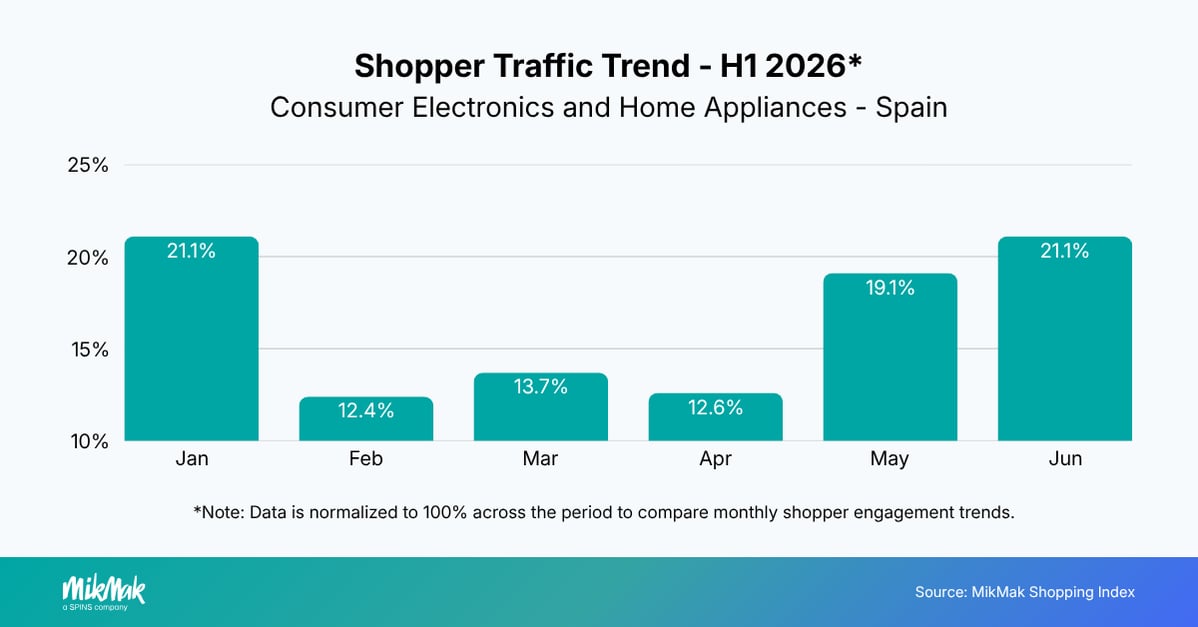
Spanish shopper engagement was strongest in January and June, with each month accounting for 21.1% of H1 Purchase Intent Clicks, while activity moderated throughout the rest of the first half.
Search drove commerce discovery
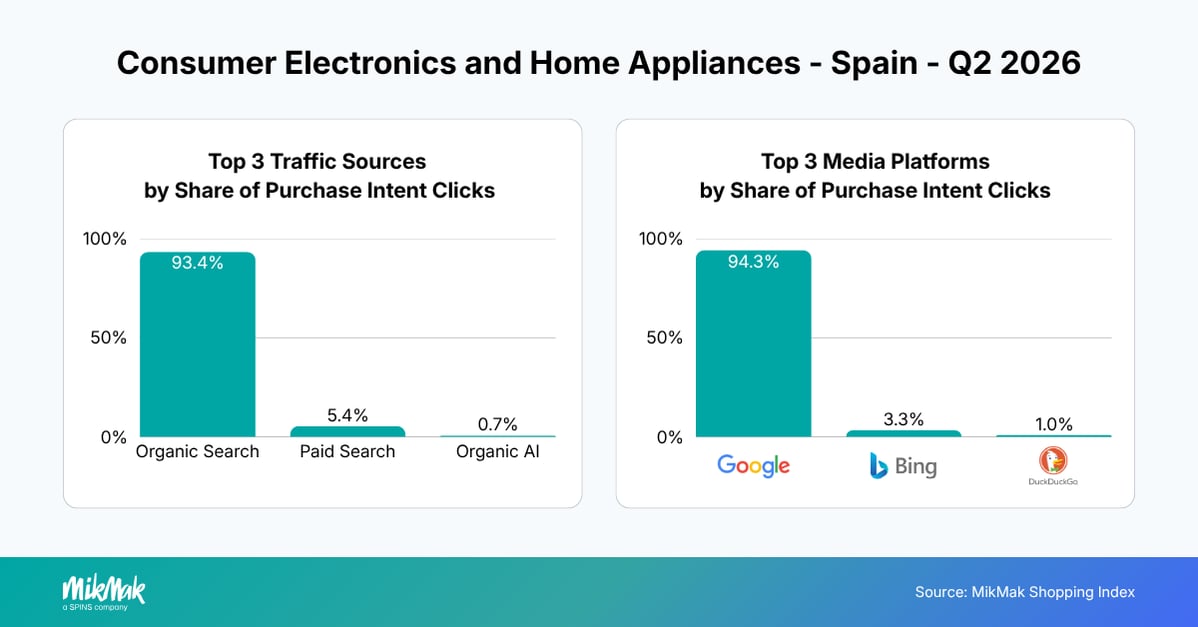
Organic search accounted for 93.4% of Purchase Intent Clicks, making Spain the most search-led market in this benchmark. Paid search contributed a further 5.4%, while paid social represented just 0.5%.
Google dominated platform performance with 94.3% of Purchase Intent Clicks. While search clearly captured high-intent shoppers, the limited contribution from paid media suggests brands have opportunities to expand commerce-enabled search, social, and display activations to generate incremental demand earlier in the purchase journey.
Key Takeaways
- Balance search investment with commerce-enabled demand generation: Search dominates the Consumer Electronics and Home Appliance purchase journey, with organic and paid search accounting for the majority of Purchase Intent Clicks across most markets. While investing in search is essential to capture in-market demand, brands should maintain commerce-enabled paid social and other upper-funnel activations to generate incremental shopper demand and build future purchase intent.
- Adapt commerce strategies to local shopper behavior: Discovery patterns vary significantly by market. The US continues to rely on a balanced mix of paid social and search, while Canada, Germany, Australia, the UK, the Netherlands, and Spain are far more search-led. Regularly reviewing commerce performance by market enables brands to allocate media budgets where they are most likely to influence shopper behavior.
- Use commerce insights to optimize media investment: Monitoring Purchase Intent Clicks by channel and platform helps brands understand where marketing investment is translating into measurable commerce outcomes. Combining these insights with ongoing testing allows teams to refine channel mix, identify opportunities to increase incremental demand, and maximize the return on media spend.
Curious to see how MikMak helps brands connect marketing with commerce and unlock first-party shopper data? Schedule a demo today.

*The MikMak Shopping Index was developed to provide a standardized set of metrics, methodology, and benchmarks to help drive brands’ business results and strategy. It is a collection of key eCommerce KPIs collected across hundreds of brands, over 250 channels, and more than 8,000 retailer integrations worldwide to understand consumer online shopping behavior.