eCommerce Analytics for Consumer Brands: 8 Insights That Drive Revenue
Every shopper interaction leaves a signal. The challenge is turning those signals into decisions that increase marketing effectiveness.
Today’s consumer brands have access to more commerce data than ever, but that data is often fragmented across media platforms, brand websites, retailers, and markets. This makes it difficult to see how shoppers move from discovery to purchase, or determine which investments are actually driving revenue.
For brands selling through multiple retailers, eCommerce analytics must extend beyond owned-site metrics like traffic and conversion rate. By enabling commerce across brand websites and media, brands can capture first-party signals that reveal which audiences, products, channels, creative assets, and retailers generate meaningful shopper action.
In this playbook, we’ll use real-world data snapshots and brand examples to explore eight eCommerce insights that can help you understand shopper demand, optimize marketing and retailer strategy, and uncover new opportunities for profitable growth.
What Is eCommerce Analytics?
eCommerce analytics is the collection and analysis of shopper, marketing, product, retailer, and sales data to understand what drives commerce performance.
For consumer brands, this means connecting data from commerce-enabled media and brand websites with retailer activity and attributable sales. A unified view helps teams answer critical questions, including:
- Which channels and campaigns drive the highest-quality shopper traffic?
- Which audiences, products, and creative assets generate the strongest purchase intent?
- Where do shoppers prefer to buy?
- How do pricing and product availability affect performance?
- Which marketing investments generate incremental sales?
Advanced eCommerce analytics platforms like MikMak centralize these signals so brands can measure performance using consistent, full-funnel commerce KPIs across channels, campaigns, and retailers. Predictive commerce analytics can take this further by helping teams forecast potential outcomes, model incremental growth, and make more confident investment decisions.
1. How Full-Funnel eCommerce Analytics Reveal Shopper Behavior Shifts
Whether your campaign objective targets top-of-funnel awareness or bottom-of-funnel conversion, commerce enablement provides the data you need to prove what works.
- Commerce insight: Full-funnel shopper traffic analysis shows where audiences engage, which creatives trigger purchase intent, and which product variants or retailers consumers prefer.
- Strategic action: Identify your high-intent audience segments based on commerce signals and optimize campaign targeting in real time. Build lookalike models from these profiles to fuel awareness campaigns, and retarget engaged shoppers with optimized commerce creative to maximize conversion.
💡Data Snapshot: Comparing Marketing Tactic Performance
A Toy brand promoted a product during December, leveraging MikMak Commerce-enabled campaigns with different goals across the funnel to capture peak holiday demand.
| Marketing Tactic (utm) | Commerce Loads | Purchase Intent Clicks | Purchase Intent Rate | Transactions | Attributable Sales Value |
| Awareness | 120,806 | 10,949 | 9.06% | 17 | $947 |
| Consideration | 93,300 | 11,598 | 12.43% | 485 | $29,962 |
| Conversion | 374,013 | 50,089 | 13.39% | 1,523 | $90,694 |
Reading the Data:
This brand demonstrates a healthy funnel and shows the value of making upper-funnel campaigns shoppable. The conversion campaign acts as the primary performance driver, generating a 13.39% Purchase Intent Rate and $90,694 in Attributable Sales Value.
At the same time, awareness and consideration campaigns also capture meaningful revenue, generating over 500 transactions and $30,000 in Attributable Sales Value.
By making upper-funnel assets shoppable, the brand captures revenue that would otherwise be lost while maintaining strong efficiency across all tactics.
What the Brand Can Do Next:
- Optimize media allocation: Analyze traffic sources by tactic mid-campaign to redirect budget toward the highest-performing channels.
- Scale high-intent profiles: Build and target lookalike audiences based on the behavioral attributes of consumer segments displaying the highest purchase intent.
- Align retail resources: Audit retailer preferences across all three tactics to ensure co-marketing dollars and inventory allocations match real consumer demand during high-volume periods.
📈 Brand Use Case: Audience Testing Unlocked Launch Efficiency for a Personal Care Brand
Challenge: A French Personal Care brand needed to identify which consumer segments would drive the highest engagement and purchase intent for a new product launch.
Solution: The brand used customized tracking to segment shoppers into four distinct groups: health-conscious, environmentally aware, beauty-focused, and retargeting audiences, actively monitoring their commerce behavior with MikMak.
Insight: The "environmentally aware" segment significantly outperformed all other groups, accounting for 33.9% of the total shopper traffic directed to retailers.
Result: The brand immediately shifted its media spend toward this high-value audience. This optimization streamlined channel, creative, and retailer selections, maximizing campaign efficiency throughout the launch.

2. How Website Analytics Identify Products Driving Shopper Demand
Enabling commerce on your brand website transforms a static digital catalog into a real-time signal of demand, showing which products at the SKU level are driving shopper intent, not just which pages are being viewed.
- Commerce insight: Ranking products by Purchase Intent Clicks reveals which items are capturing shopper demand across your site, and which deserve priority visibility across both owned and paid media.
- Strategic action: Use SKU-level demand signals to optimize product visibility across category pages and product listings. If lower-positioned products consistently generate higher Purchase Intent Clicks, reposition them higher in the assortment. Apply these insights to improve onsite navigation and inform paid media prioritization.
💡Data Snapshot: Identifying SKUs That Capture Shopper Demand
An Alcohol brand analyzed SKU-level shopping behavior across its commerce-enabled website category page to understand which products were driving the highest shopper purchase intent within its owned digital experience.
| Page URL | Purchase Intent Clicks | Purchase Intent Rate |
| www.examplewhisky.com/fruity-category/wildpear-reserve | 1,645 | 55.26% |
| www.examplewhisky.com/fruity-category/golden-orchard-12-year | 847 | 39.86% |
| www.examplewhisky.com/fruity-category/berry-cask-small-batch | 379 | 46.73% |
Reading the Data:
Wild Pear Reserve emerges as the clear demand leader, generating the highest volume of Purchase Intent Clicks and the strongest conversion efficiency. This signals it is currently the most in-demand product in the category.
What the Brand Can Do Next:
- Optimize onsite product merchandising: Reorder SKUs on category pages based on purchase intent signals, ensuring high-demand products are surfaced earlier in the browsing experience.
- Align media with demand leaders: Prioritize SKUs generating the strongest purchase intent in paid media and retail media activations to amplify existing demand signals.
- Improve commerce enablement across pages: Identify high-traffic but non-shoppable or underperforming category experiences and extend commerce functionality to reduce drop-off in high-intent moments.
📈 Brand Use Case: OTC Medicine Brand Unlocked Product-Level Demand Signals
Challenge: An over-the-counter medicine brand lacked visibility into which products on its website were driving the strongest shopper demand and influencing retail purchase behavior.
Solution: By integrating MikMak across its website, the brand was able to capture product-level shopper behavior based on real purchase intent signals.
Insight: The brand discovered that a single product page drove nearly 25% of all retailer-directed shopper traffic, despite receiving minimal support in paid media campaigns.
Result: The brand reallocated seasonal marketing investment away from lower-performing products and increased focus on the product generating the strongest organic shopper demand.
3. How Cross-Channel Analytics Measure Media Performance
Not every platform or campaign serves the same purpose. Comparing traffic sources from paid, earned, and organic initiatives helps you identify your most profitable marketing combinations and allocate budget to the environments that qualify shoppers most effectively.
- Commerce insight: Evaluating initial engagement metrics alongside actual conversion likelihood reveals where your audience is simply browsing versus where they are actively preparing to buy.
- Strategic action: Monitor performance continuously during your live campaigns and shift budget toward the specific channels and creative pairings that deliver the best results, maximizing your conversion potential and ROI.
💡Data Snapshot: Uncovering Hidden Performance Peaks
A Food and Beverage brand analyzed shopper engagement across its commerce-enabled media mix to evaluate channel efficiency.
Reading the Data:
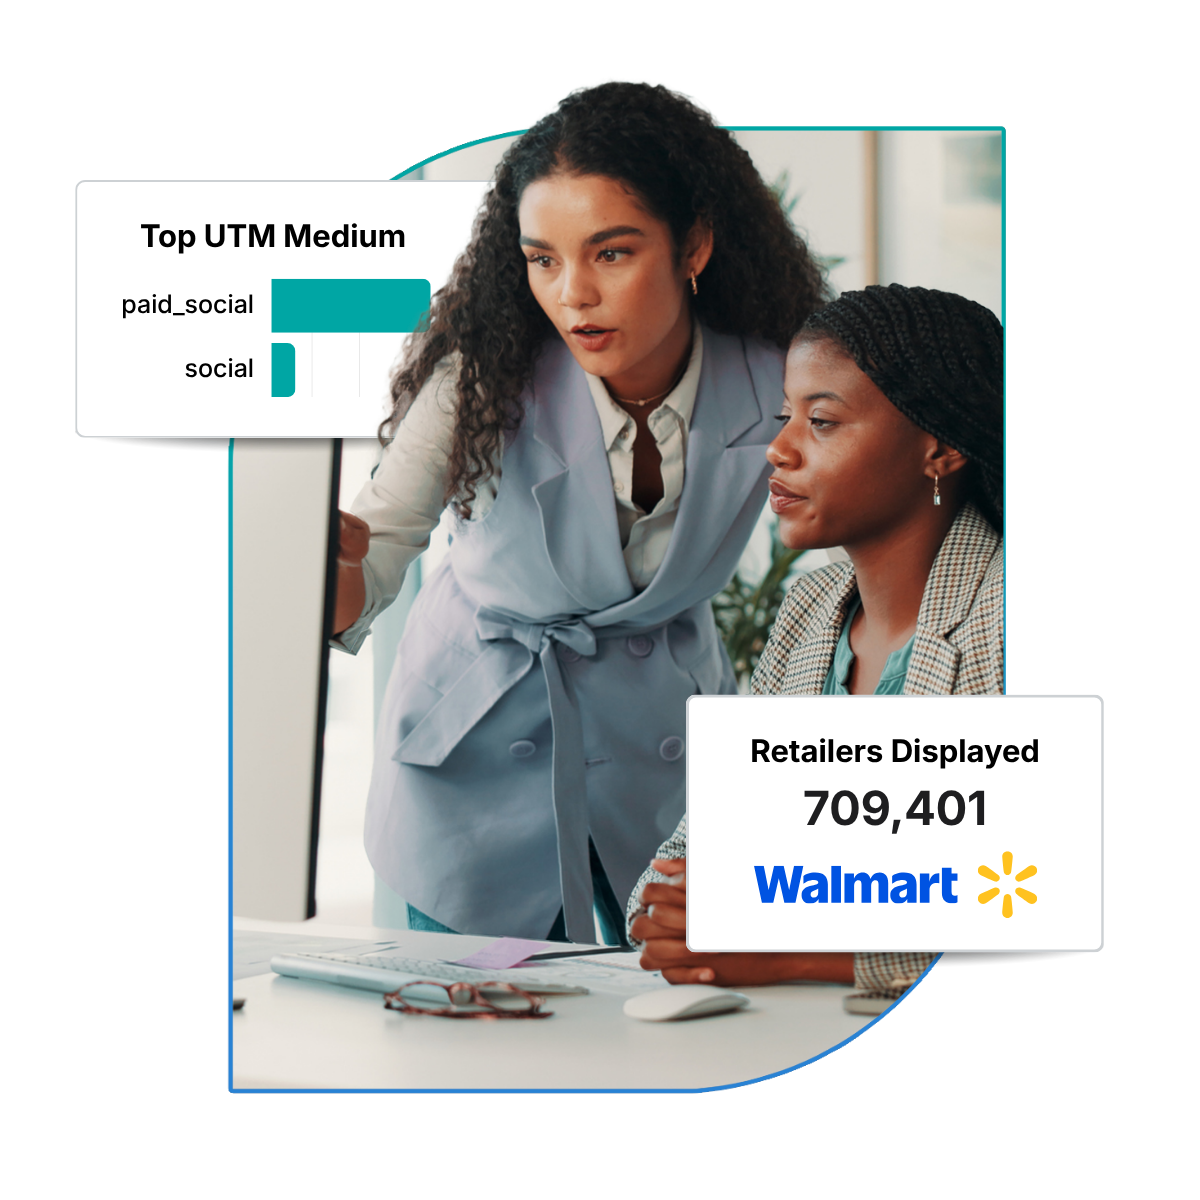
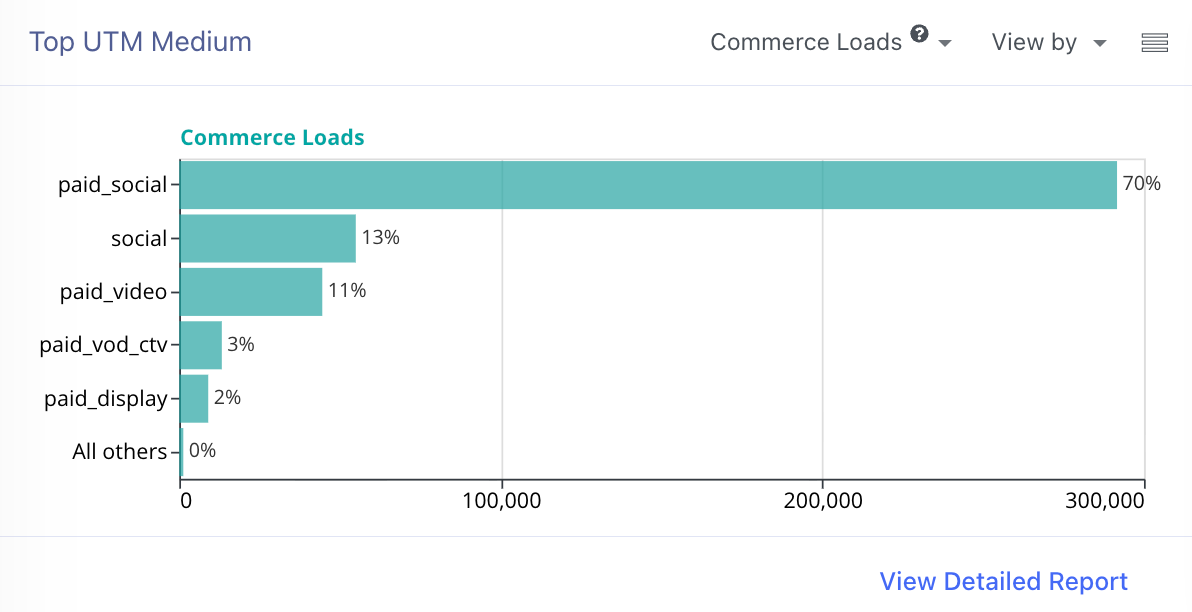
- Paid vs. organic: Shoppers have engaged with the brand’s commerce-enabled content mostly on social media, with paid social driving 70% of total engagement. Organic content (like shoppable 'link in bio') has contributed a significant 13% in free incremental traffic.
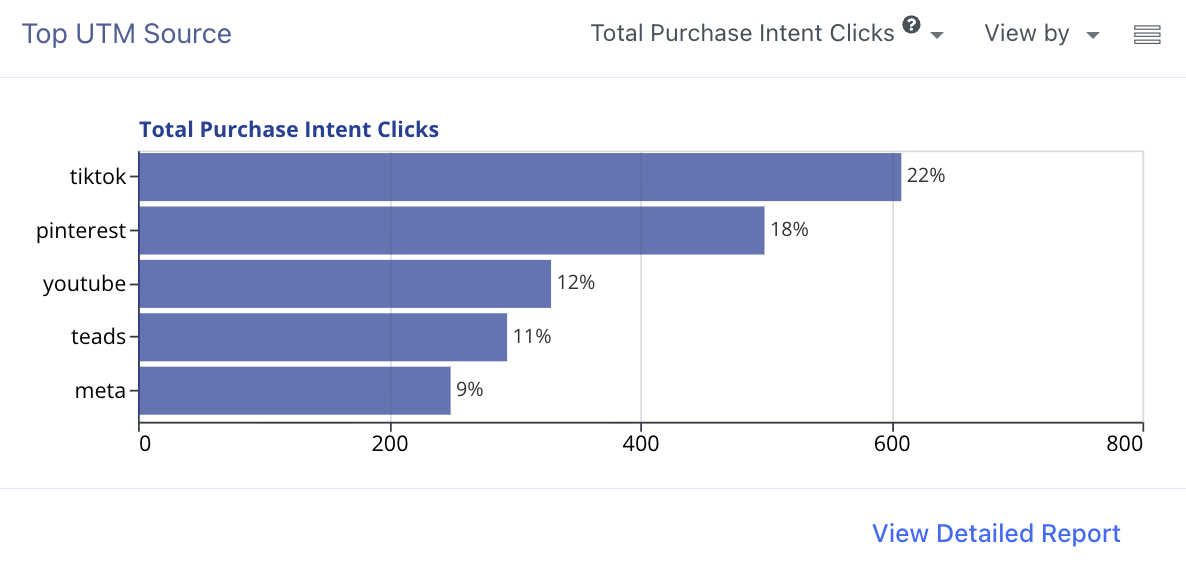
- Channel performance: While TikTok leads in volume (driving 22% of shopper traffic to retailers), a deep dive into the dates of Feb 26–28 reveals a performance peak for YouTube.
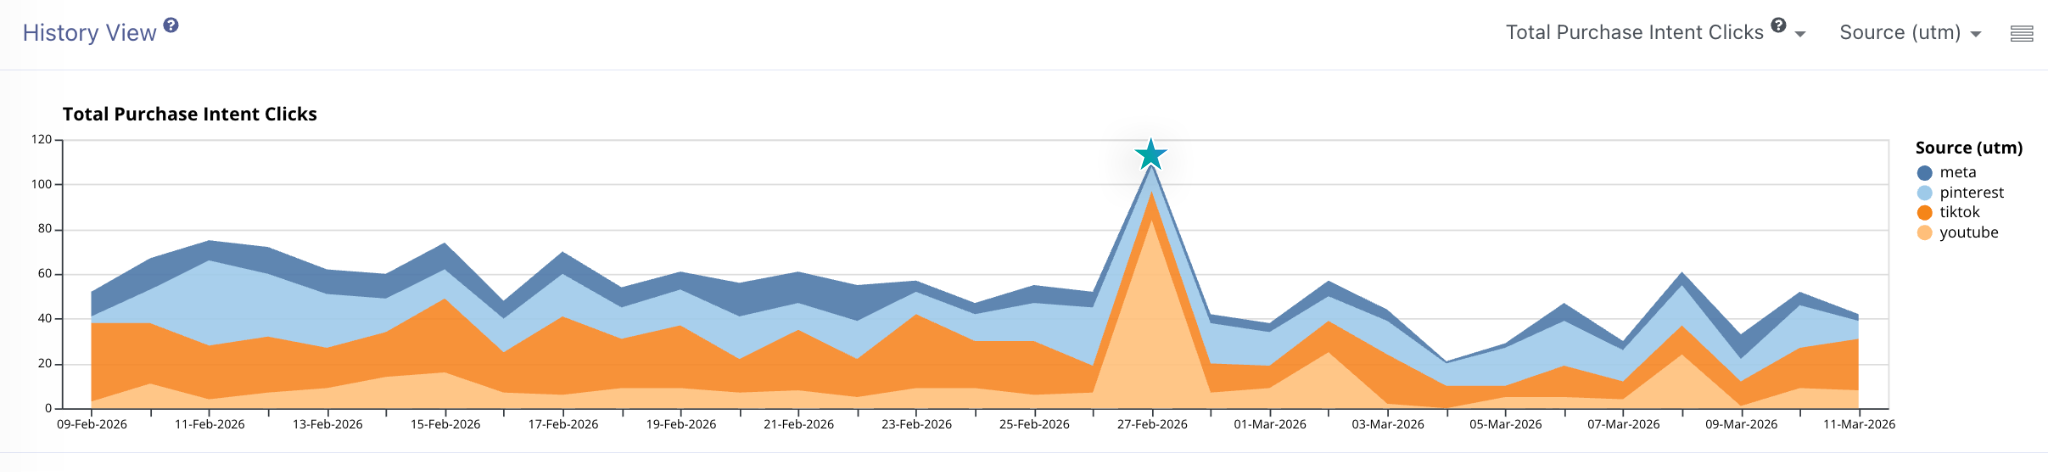
- Conversion efficiency: Although the YouTube campaign was optimized for Awareness, it has delivered a 4.4% Purchase Intent Rate, outperforming other campaigns on TikTok, Meta, and Pinterest.
|
Source (utm) |
Marketing Tactic (utm) |
Purchase Intent Rate |
|
YouTube |
Awareness |
4.38% |
|
|
Awareness |
3.17% |
|
TikTok |
Consideration |
0.34% |
|
Meta |
Awareness |
0.32% |
|
Meta |
Consideration |
0.26% |
|
TikTok |
Awareness |
0.11% |
What the Brand Can Do Next:
- Pivot funnel strategy: Test future YouTube campaigns with consideration and conversion objectives to see if they can unlock an even higher bottom-line ROI.
- Audit and cross-pollinate creative: Identify the specific imagery and messaging used in the winning YouTube campaign and test those assets on other active social channels.
- Scale high-performing audiences: Scale winning combinations by building lookalike and retargeting segments based on the traits of the best-performing campaign audiences.
📈 Brand Use Case: Healthcare Brand Discovered Conversion Opportunities on YouTube
Challenge: A Healthcare brand launching a new product needed to determine which social media platform would complement their traditional media mix most effectively to drive retail sales.
Solution: The brand deployed MikMak Commerce for media to benchmark performance side-by-side across programmatic and social channels.
Insight: YouTube significantly outperformed every other platform, delivering a 6x higher conversion likelihood and 2x longer engagement times.
Result: Based on this data, the brand confidently reallocated its marketing budget away from underperforming campaigns and scaled its investment in YouTube.
4. How Retailer Analytics Reveal Consumer Buying Preferences
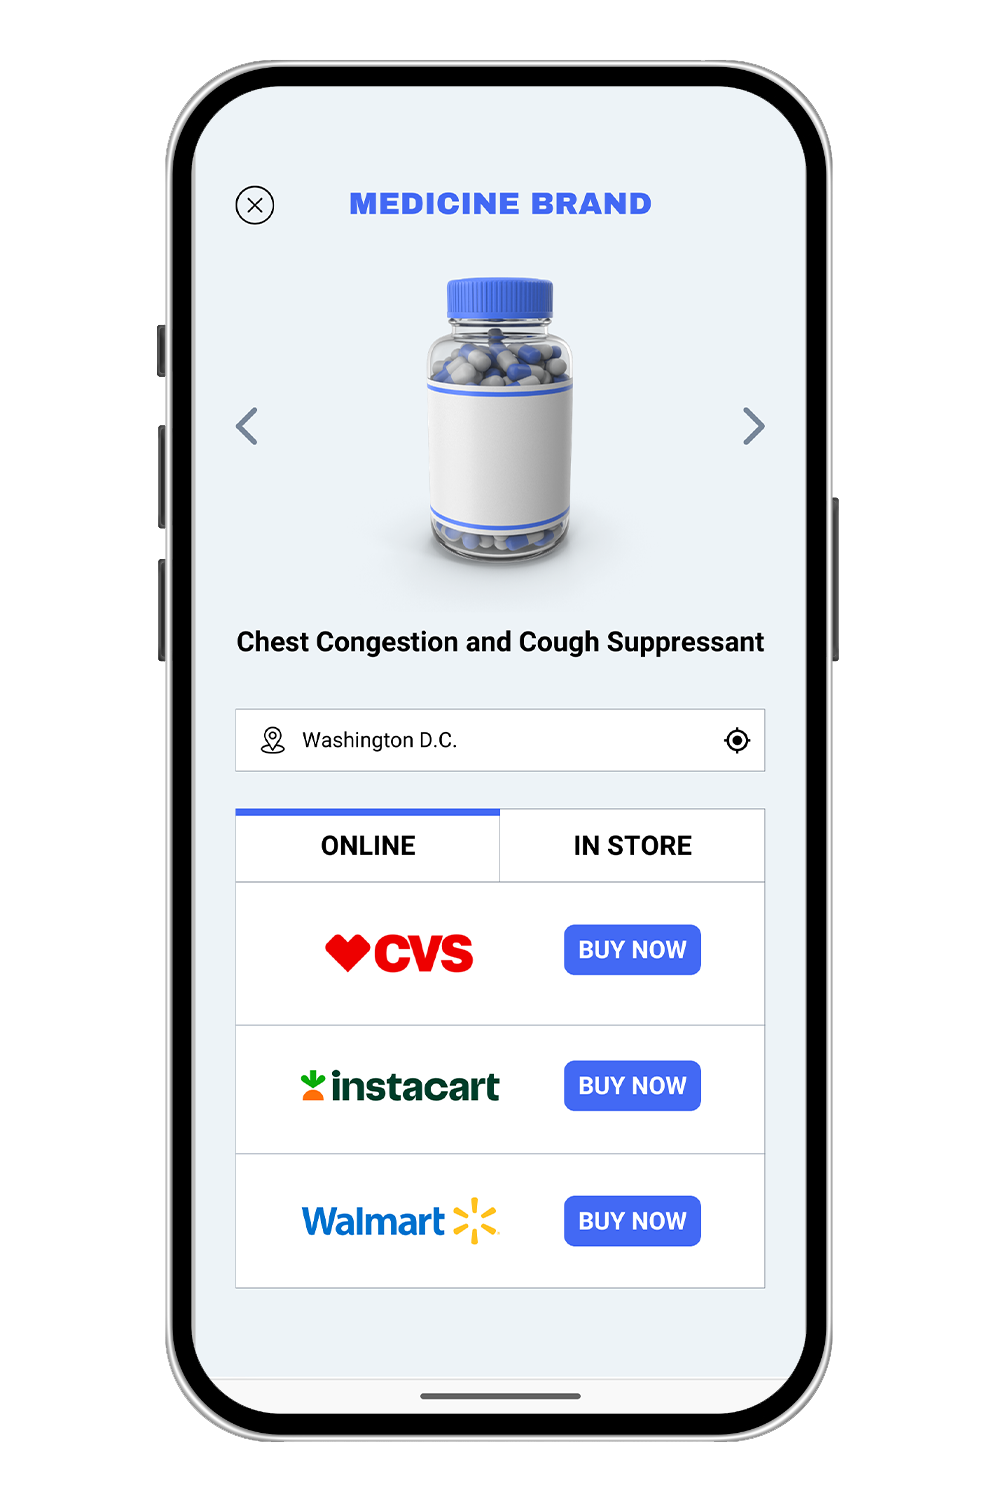
Are you backing the right retail partners? Monitoring which retailers shoppers choose when presented with multiple purchase options reveals consumer preferences, regional demand patterns, and untapped growth opportunities.
- Commerce insight: Tracking shopper traffic across mass merchants, delivery apps, specialist retailers, and regional grocers reveals where consumers actually prefer to buy. It also exposes which complementary products consumers add to their digital carts alongside your brand items.
- Strategic action: Use actual retailer preference data to guide your Retail Media Network (RMN) investments. Direct your search-boosting and co-marketing budgets to the specific retailers where your consumers naturally want to shop, and use these concrete demand metrics to negotiate better physical and digital shelf placement.
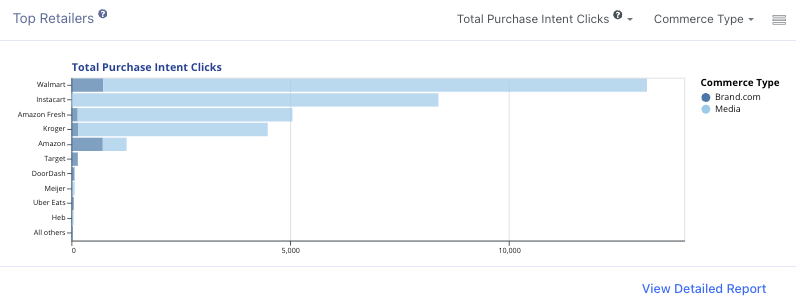
💡Data Snapshot: Mapping Shopper Distribution across Retailers
A Food brand monitored its shoppable media campaigns over a 30-day period to evaluate consumer checkout preferences.
|
Retailer Name |
Retailer Displayed |
Purchase Intent Clicks |
Retailer Click-Through Rate |
|
Walmart |
709,401 |
13,151 |
1.85% |
|
Instacart |
574,285 |
8,384 |
1.46% |
|
Amazon Fresh |
319,867 |
5,050 |
1.58% |
|
Kroger |
291,474 |
4,486 |
1.54% |
|
Amazon |
135,565 |
1,261 |
0.93% |
Reading the Data:
Walmart captured 40% of the brand's total generated shopper traffic, securing a 1.85% Retailer Click-Through Rate (shopper clicks / retailer option displayed in brand content). Notably, 94% of that Walmart traffic came directly from paid shoppable media, while 6% originated from the brand website.
What the Brand Can Do Next:
- Optimize media pairings: Filter this data further to see which creative assets and social channels drive Walmart traffic versus Instacart to optimize active campaigns.
- Inform cross-category strategy: Analyze full cart data to discover which other products consumers bought alongside the brand’s SKUs to guide future product bundling or "Complete the Meal" creative strategies.
- Justify media investments: View the Attributable Sales Value generated at Walmart to justify increased marketing spend with primary retail partners.
📈Brand Use Case: Reckitt Uncovered Surprising Retailer Performance in Key Product Categories
Challenge: Reckitt needed to understand real-world buying habits for a specific Personal Care brand rather than relying on historical market assumptions.
Solution: The team implemented multi-retailer checkout options across their brand content, gathering direct first-party data on consumer checkout preferences.
Insight: Contrary to internal expectations, the MikMak data revealed that Walmart significantly outperformed Amazon for this specific product category.
Result: By giving shoppers a choice, Reckitt captured actual consumer preferences and stopped the data loss that typically happens when driving traffic to a single retailer.
“Prior to having this type of technology, we would be driving directly to a retailer, like we'd be driving directly to Target or Walmart, and we would lose all the data from there. Now that we give customers the option, it actually helps us understand where our customers are buying our products, where did people prefer to buy them, and it's not equal among our brands.”
- Director, Full Funnel Customer Engagement

5. How Creative Analytics Improve Campaign Performance
Commerce data allows you to move past vanity metrics like views, video completions, and social likes. It isolates the exact design variations, headlines, and call-to-action styles that move consumers to buy.
- Commerce insight: By monitoring ‘shop’ actions, clicks on retailers, and conversion metrics, you can determine which specific creative assets maximize your revenue opportunities.
- Strategic action: Optimize your paid media spend mid-campaign. Immediately scale the specific creative messaging that demonstrates clear conversion traction, and pause underperforming assets to eliminate ad waste.
💡Data Snapshot: Detecting High-Conversion Creative Assets
A Fragrance brand ran a paid social campaign for Valentine’s Day on TikTok and A/B tested three distinct video creative variations to see which asset drove the strongest conversion behavior.
|
Content (utm) |
Commerce Loads |
Purchase Intent Clicks |
Purchase Intent Rate |
Intent Value |
|
video1 |
6,417 |
123 |
1.9% |
€9,154.20 |
|
video2 |
7,960 |
166 |
2.1% |
€12,523.40 |
|
video3 |
7,022 |
64 |
0.9% |
€4,909.15 |
Reading the Data:
Video 2 emerged as the undisputed winner across every commerce KPI, generating both the highest shopper traffic volume and €12,523.40 in Purchase Intent Value. Video 3 underperformed, capturing less than half the conversion effectiveness of video 2.
What the Brand Can Do Next:
- Optimize spend: Reallocate the remaining campaign budget away from Video 3 and immediately funnel those resources into the high-performing Video 2 asset.
- Analyze platform efficiency: Compare this TikTok performance against concurrent campaigns on YouTube and Meta to isolate the most profitable media environment for this product portfolio.
- Deconstruct creative elements: Audit Video 2 to identify the specific visual hooks, pacing, or copy elements that triggered the high purchase intent value, embedding those rules into future creative briefs.
📈Brand Use Case: A Skincare Brand Drove 3.7x Higher Conversion Efficiency with Benefit-Led Messaging
Challenge: A Skincare brand launching a new product wanted to know whether celebrity-led messaging or product-benefit messaging would drive higher quality traffic to its retail partners.
Solution: The brand structured an active A/B test using MikMak Commerce-enabled ads to compare the two creative approaches side-by-side.
Insight: The product-benefit creative completely outpaced the star-power creative, generating a 1.8x higher rate of shoppers clicking through to retail carts.
Result: The brand optimized its media allocation toward the benefit-led creative. This data-backed adjustment allowed the launch to achieve a 3.7x higher conversion efficiency than industry benchmarks.
6. How Inventory and Pricing Analytics Protect eCommerce Revenue
To protect hard-earned demand and maintain digital market share, brands must monitor retail pricing dynamics and stock levels. Daily availability insights allow you to see how localized shelf changes impact consumer purchase behavior.
- Commerce insight: Tracking inventory status and price points by retailer, SKU, and geography exposes the stock outages, competitive gaps, and pricing inconsistencies that may cause shoppers to abandon their purchase journeys.
- Strategic action: Pause or redirect campaigns away from retailers facing out-of-stock hurdles, quickly alert your fulfillment teams to inventory shortages, and ensure your pricing strategies remain aligned among key partners.
💡Data Snapshot: Identifying Localized Availability and Price Gaps
A Home Appliance brand monitored the pricing and stock status of a core SKU across its retail network in France.
Table 1: Price and Stock Comparison Between Retailers
|
Date ↑ |
Retailer |
Average Price |
In Stock |
|
2026-06-17 |
Boulanger |
€592.07 |
Yes |
|
2026-06-17 |
BUT |
€599.99 |
No |
|
2026-06-17 |
Darty |
€599.99 |
Yes |
|
2026-06-17 |
Ubaldi |
€699.99 |
No |
Table 2: Price and Stock Comparison Over Time at a Selected Retailer
|
Date ↑ |
Retailer |
Average Price |
In Stock |
|
2026-06-17 |
Boulanger |
€592.07 |
Yes |
|
2026-06-16 |
Boulanger |
€592.07 |
Yes |
|
2026-06-15 |
Boulanger |
€588.42 |
Yes |
|
2026-06-14 |
Boulanger |
€588.42 |
No |
Reading the Data:
Table 1: Despite broad digital distribution, only two out of four primary retailers can currently fulfill orders. Furthermore, a major €108 pricing gap exists between partners, which can influence shopper choice and conversion behavior.
Table 2: Boulanger has resolved a temporary out-of-stock issue on June 14, and raised the product price as soon as inventory stabilized.
What the Brand Can Do Next:
- Mitigate wasted ad spend: Pause all active media driving traffic to BUT and Ubaldi immediately until retail inventory replenishes.
- Quantify revenue impact: Combine this stock timeline with overall Attributable Sales metrics to calculate the exact revenue opportunities missed during retailer out-of-stock windows.
- Optimize retail supply chains: Share these inventory trends directly with the supply chain and retail sales teams to optimize replenishment schedules and prevent future stockouts at key retailers.
📈Brand Use Case: Global Fragrance Brand Prevented $17K in Lost Sales via Inventory-Aware Media
Challenge: A global Fragrance brand was missing revenue opportunities and creating negative consumer experiences due to out-of-stock products appearing within its active media campaigns.
Solution: The brand used MikMak Commerce to make its shoppable media inventory-aware, dynamically displaying only the retailer options that had products ready to ship.
Insight: Data revealed that 15% of shoppers successfully switched to an alternative retailer when their primary preference ran out of stock, driving 5% of the brand's total add-to-cart volume.
Result: By capturing these alternative purchases, the brand saved an estimated $17,000 in immediate revenue during the campaign window and subsequently scaled inventory-driven shoppable media throughout all global campaigns.

7. How Predictive Commerce Analytics Reveal Incremental Growth
Historical reporting explains what happened. Predictive analytics solutions like MikMak Aura help brands understand what is likely to happen next. By combining commerce data with forecasting and incrementality modeling, brands can evaluate potential outcomes before committing additional budget.
- Commerce insight: Advanced modeling separates baseline sales from marketing-driven sales, allowing brands to identify which investments generate true incremental growth rather than simply capturing demand that already exists.
- Strategic action: Use predictive modeling and scenario planning to forecast revenue impact, identify diminishing returns, and optimize budget allocation across channels, retailers, and media investments.
💡Data Snapshot: Quantifying Baseline Revenue vs. Media Channel Incremental Lift
A high-growth consumer brand analyzed its total retail revenue distribution with MikMak Aura, to evaluate the exact financial contribution of its active marketing channels.
Table 1: Revenue Contribution by Baseline and Marketing Channels
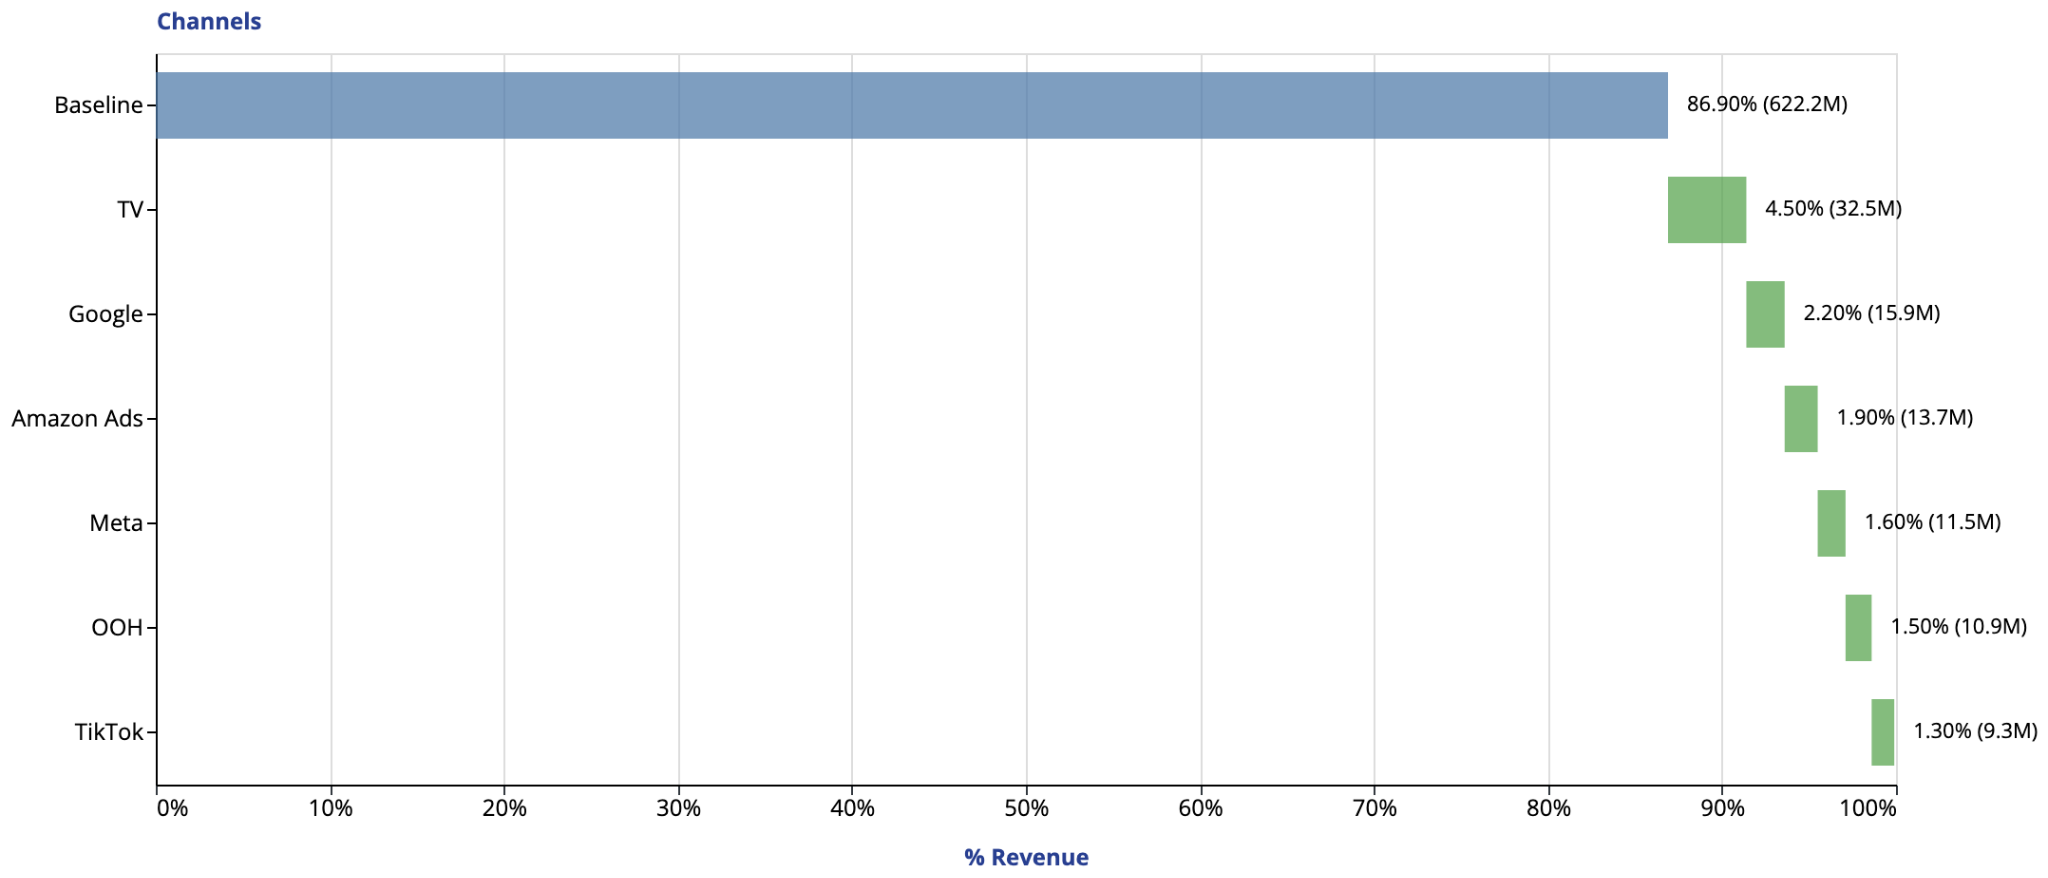
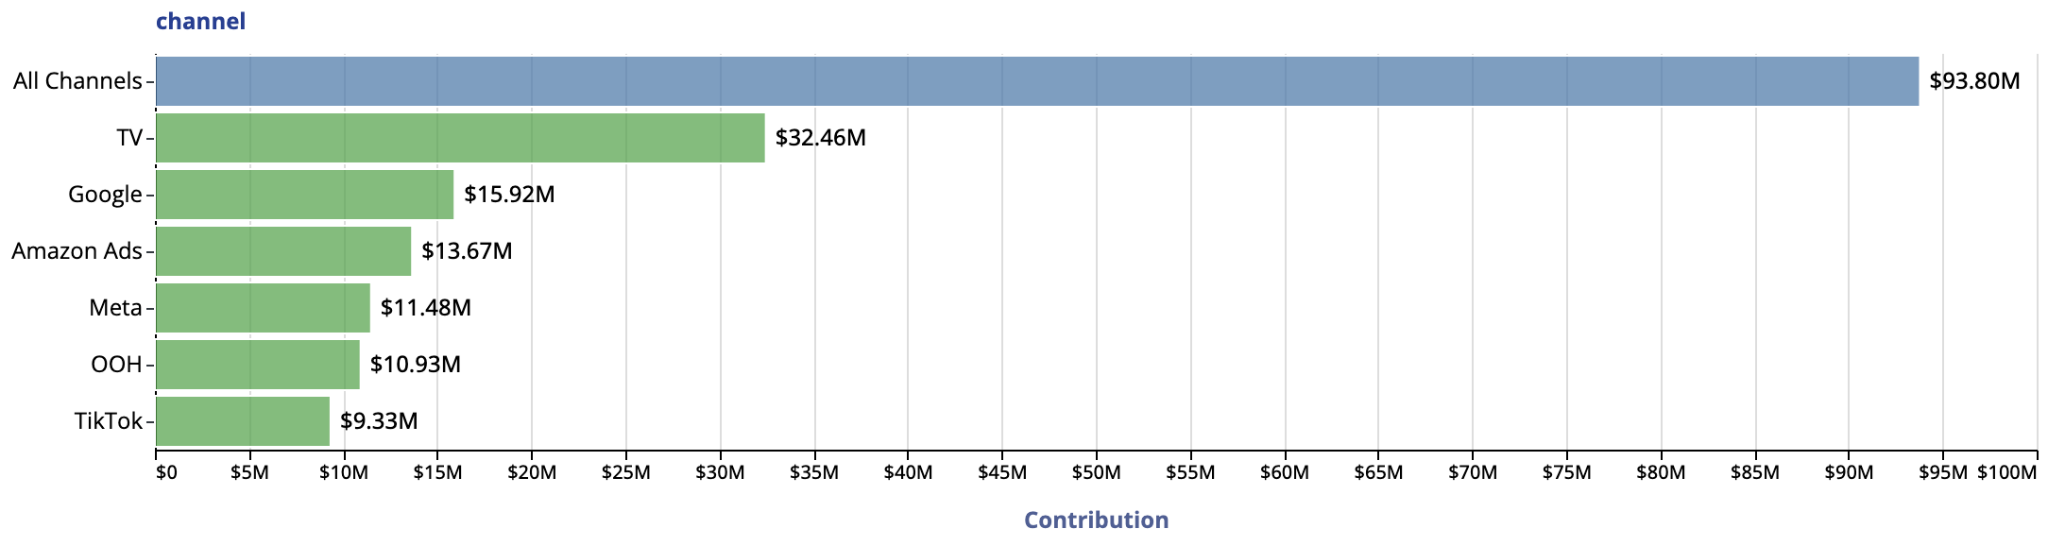
Table 2: Incremental Sales Contributions of Media Channels
Reading the Data:
Table 1: This advanced mix modeling isolates the specific variables driving retail success. While the brand maintains a powerful foundation (baseline), accounting for 86.90% of total sales ($622.20M), active media efforts successfully generated an additional $93.80M in purely incremental revenue.
Table 2: Looking closer at the media breakdown, traditional TV advertising serves as the largest top-line revenue driver at $32.46M. However, digital platforms like Google ($15.92M) and Amazon Ads ($13.67M) also contribute highly efficient, targeted performance volume that bridges upper-funnel awareness with bottom-funnel retail conversion.
What the Brand Can Do Next:
- Set operational spend caps: Map the response curves for TV and Google to locate the exact point of diminishing returns, implementing hard spend ceilings before reaching audience saturation.
- Run budget reallocation simulations: Use MikMak Aura predictive optimization engine to simulate moving 10% of underperforming social media budgets into high-velocity search or retail media networks to project margin changes instantly.
- Maximize bottom-line margins: Audit the profit margins of each individual channel against their incremental contribution values to ensure the brand is prioritizing budget for the most profitable sales volume rather than just pursuing raw top-line revenue.
📈Brand Use Case: Made by Gather Identified a $900K Incremental Sales Opportunity via Predictive Optimization
Challenge: Made by Gather struggled to get a clear apples-to-apples comparison between marketing channels. The team needed insights to deploy incremental dollars efficiently without relying on time-consuming manual analysis.
Solution: The team leveraged the MikMak Aura Optimizer scenario-planning tool to forecast potential incremental sales and gain a holistic performance view throughout campaigns.
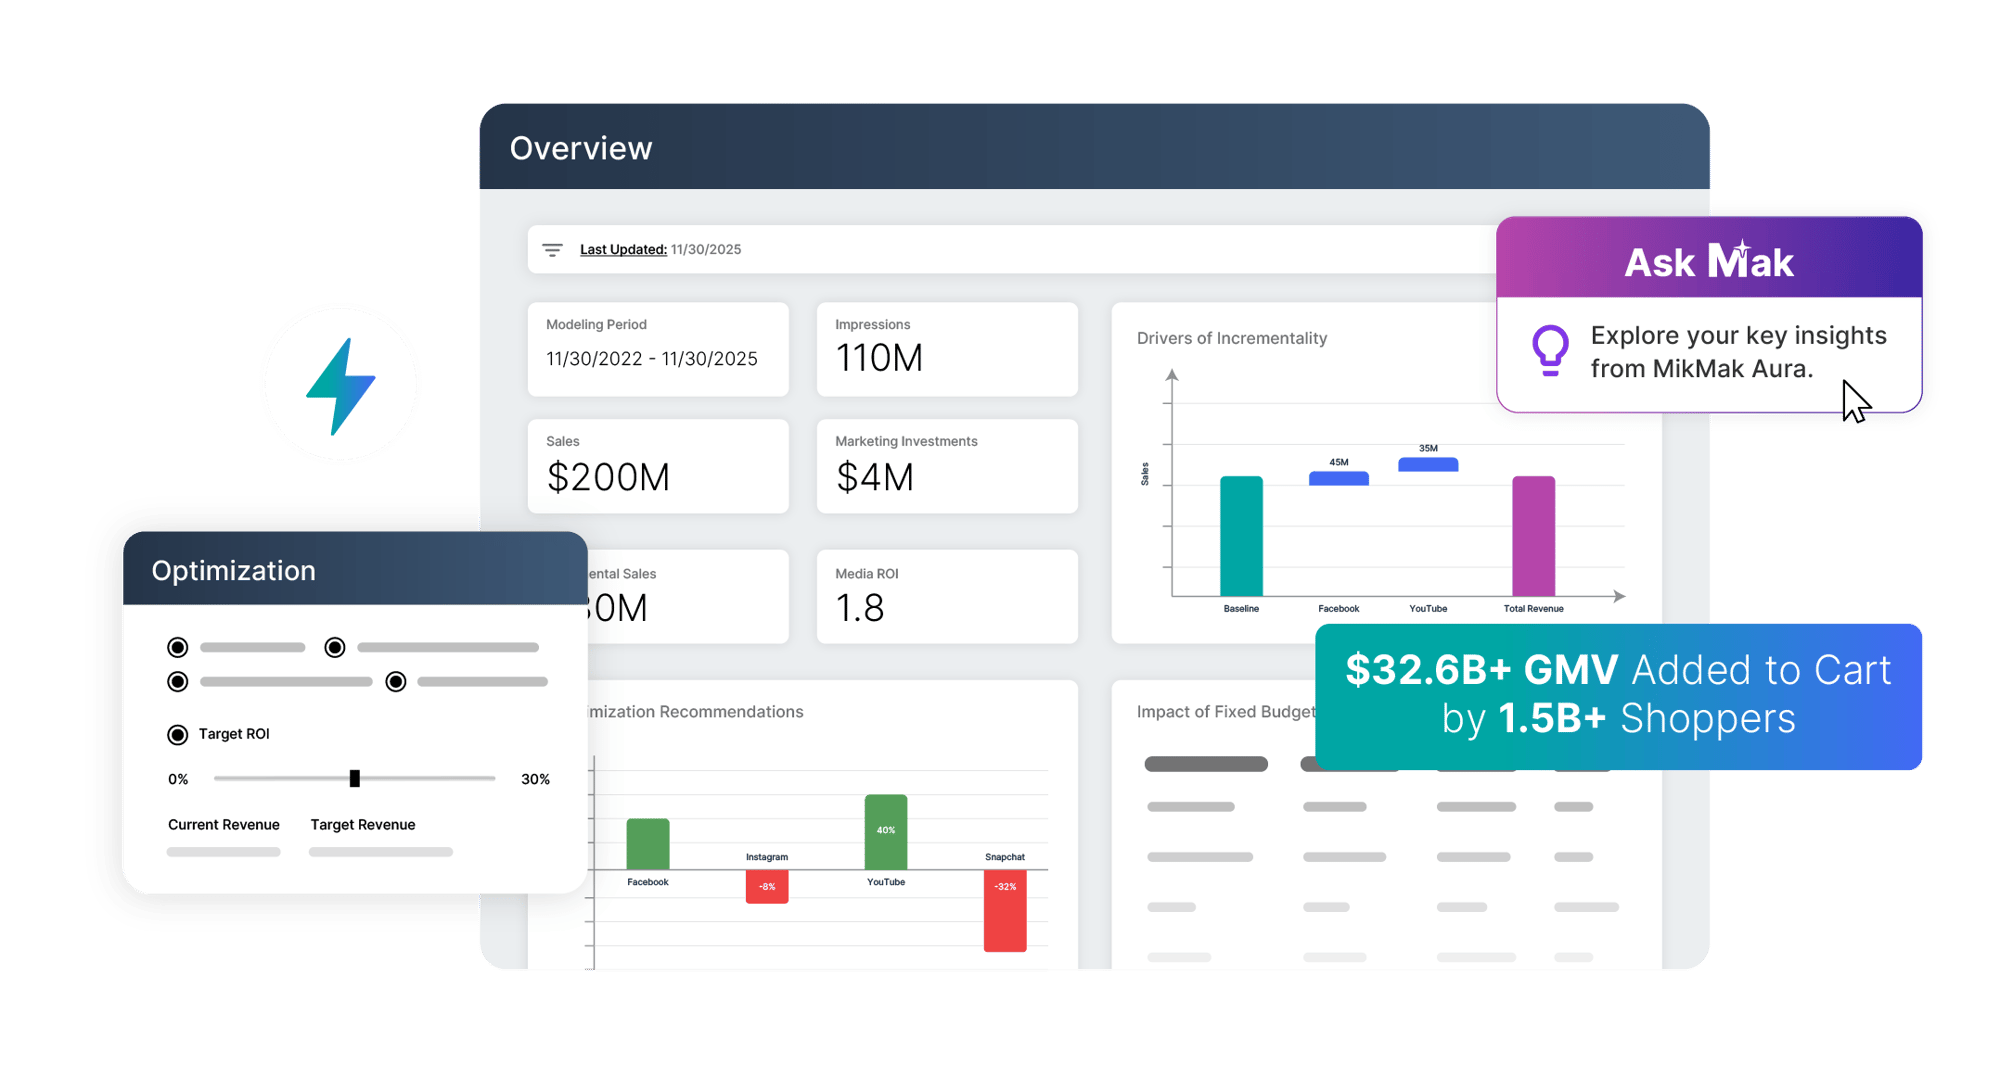
Insight: The software automated the analysis and highlighted the highest modeled ROI initiatives, pinpointing Best Buy retail media as the top return within the plan.
Result: Made by Gather successfully identified a $900,000 incremental sales opportunity, providing a clear, data-backed roadmap to maximize bottom-line impact.
8. How Unified Commerce Data Accelerates Marketing Decisions
Commerce data delivers the most value when it is unified across channels, campaigns, audiences, and retailers. Without a centralized view, teams spend valuable time reconciling reports instead of optimizing performance.
- Commerce insight: Bringing commerce and media performance data into a single view helps brands identify the channels, campaigns, audiences, and retailers driving measurable business outcomes. Instead of stitching together disconnected reports and KPIs, teams can surface insights in real time and act before opportunities are lost.
- Strategic action: Centralize commerce intelligence across your organization. Equip teams with shared dashboards and AI-powered analytics tools that reduce reporting time, improve visibility, and accelerate optimization across markets and campaigns.
💡Data Snapshot: From Manual Reporting to Instant Answers
A multinational CPG enterprise wants to evaluate campaign performance across multiple regions without waiting for agency reports or manually consolidating data.
Using Analyze with Mak, the team can query its commerce data in natural language, instantly surfacing answers to questions such as:
"Which media sources generated the highest Attributable Sales Value for our core SKU last week?"
Instead of spending hours pulling reports, the team immediately identifies top-performing channels, retailers, and campaigns, allowing them to make optimization decisions while campaigns are still live.
📈Brand Use Case: Garrison Brothers Unified Commerce and Media Data for Faster Optimization
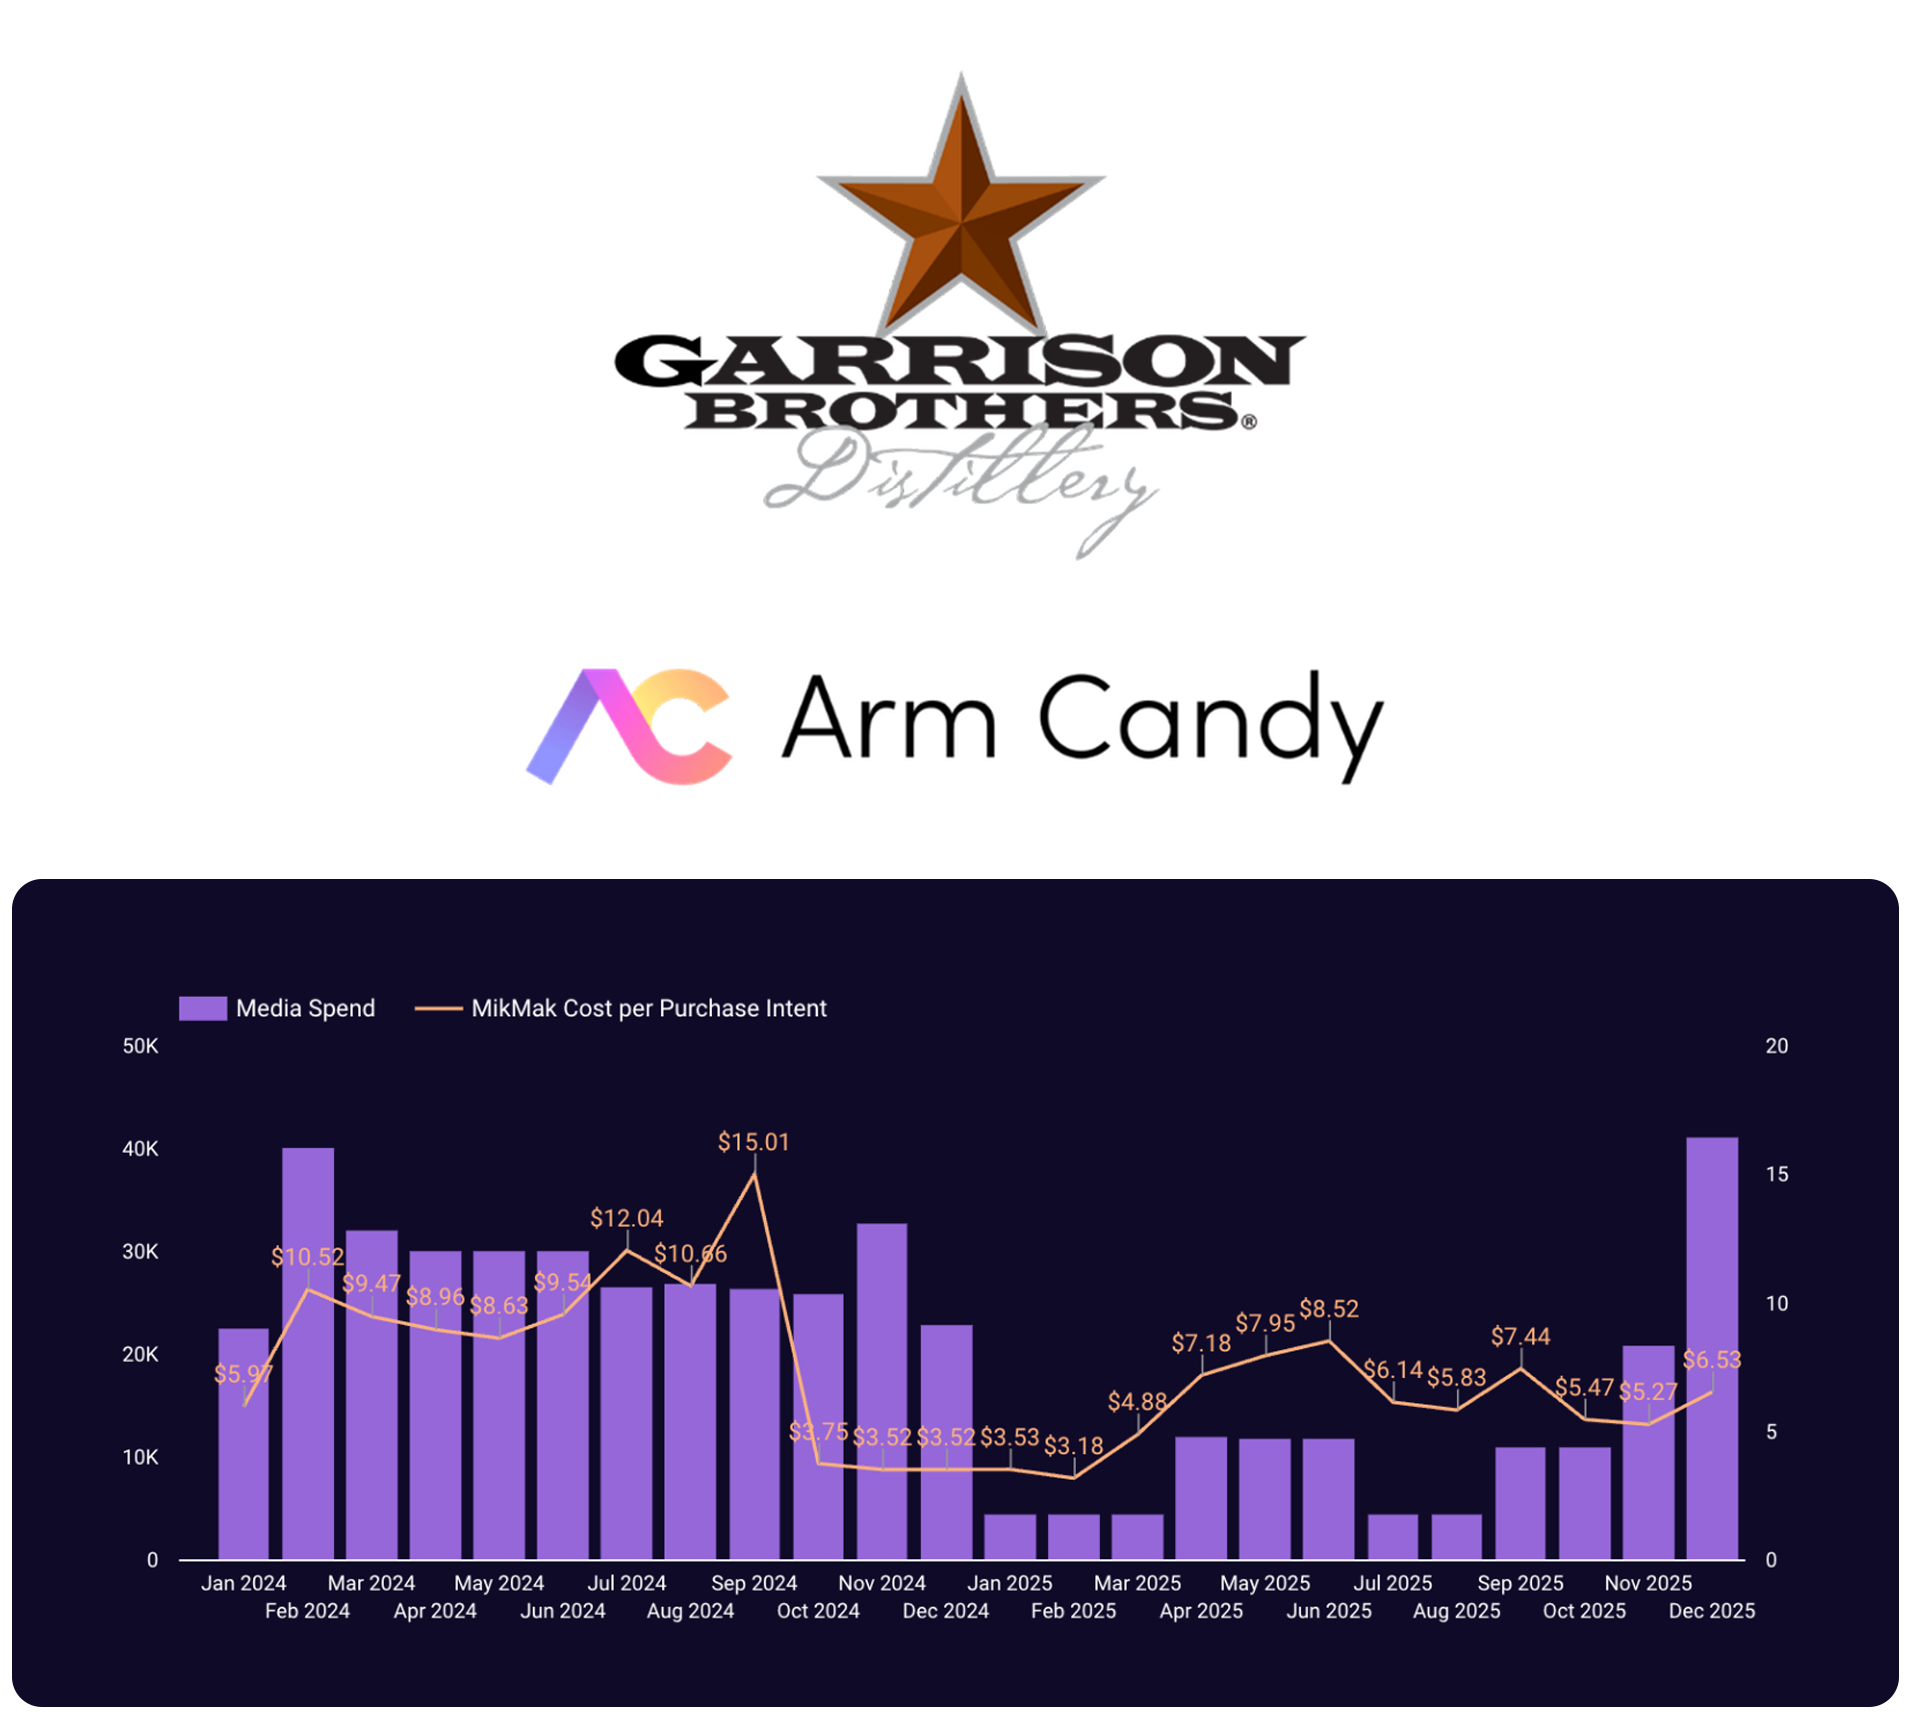
Challenge: Garrison Brothers and its media agency, Arm Candy, needed a more efficient way to connect media spend and commerce performance data throughout seasonal campaigns.
Solution: The team integrated MikMak commerce performance data directly into its business intelligence environment using the MikMak Insights API.
Insight: Centralizing reporting created a single source of truth among media and commerce teams, enabling faster access to performance insights and more agile campaign management.
Result: The team used this constant, direct data link to make rapid, weekly optimizations. This integration eliminated reporting delays, saved 1 hour per week per person on manual tracking, and delivered a 10.7% decrease in overall costs.
Turn Commerce Measurement into Your Competitive Advantage
The consumer brands that win do not rely on assumptions, and they do not wait for end-of-campaign reports to calculate digital ROI. By enabling commerce across every digital touchpoint and embedding AI-powered eCommerce analytics into your strategy, you transform marketing from an unpredictable cost center into a clear revenue engine.
Measuring the complete shopper journey provides three unmistakable business advantages:
- Key commerce metrics: You move past vanity metrics to track actual commerce impact with Purchase Intent Clicks, Retailer Preference shifts, and Attributable Sales Value.
- Agility in action: Real-time optimization lets you eliminate ad waste instantly by pausing out-of-stock product campaigns, reallocating capital to high-performing creative, and scaling winning platforms mid-campaign.
- Stronger retailer partnerships: Sharing concrete, first-party consumer demand data shifts your conversations with retail partners away from generic pitches and transforms them into strategic, data-driven joint business planning.
The strongest commerce measurement strategies do more than explain what happened after a campaign ends. They give teams a shared, timely view of performance—and the confidence to decide what to do next.
Benchmark Your Brand’s Commerce Marketing Maturity
How effectively is your brand connecting inspiration, shopper intent, and retailer sales? Explore the eCommerce Enablement Guide to assess your current approach and identify the next steps for building a more measurable, scalable multi-retailer strategy.