
Food and Beverage Commerce Outlook: The Shopper Signals Shaping Growth
What commerce signals reveal about shoppers’ paths to purchase across channels and retailers
According to McKinsey, Food and Beverage industry volume growth is now below 1% annually, while 61% of consumers say price matters more to them today than it did two years ago. At the same time, private label continues to gain ground, with 28% of consumers saying they are buying more private-label products.
As shoppers become more selective about where and how they spend, brands need to look beyond attention to understand where purchase intent forms, where shoppers choose to buy, and how they move from discovery to purchase.
Those paths are not the same everywhere. They vary across markets, channels, retailers, and moments, creating a more complex commerce landscape for marketers to navigate.
Using MikMak Shopping Index* data, we analyzed these changing paths to purchase to show how Food and Beverage shopper engagement is distributed across media and brand websites, where purchase intent is strongest, and where opportunities exist to improve the path from marketing engagement to retailer purchase.
From Demand to Purchase: Understanding the Food and Beverage Commerce Journey
Food and Beverage shoppers rarely follow a single, predictable path to purchase. They might discover a product through social media or search, visit a brand website to learn more, and then purchase through a preferred retailer. Others may go directly from a paid media ad to Walmart, Amazon, Carrefour, or another retailer without visiting the brand website. The path also varies by market, channel, and shopping moment.
Media and Brand Websites Play Complementary Roles in the Path to Purchase
MikMak Shopping Index data shows that media currently drives the most Food and Beverage shopper traffic from shoppable content to retailer partners, accounting for 61.0% of Purchase Intent Clicks, compared with 35.6% for brand websites. At the same time, brand websites show a much stronger likelihood for conversion, with a Purchase Intent Rate of 26.1%, compared with 4.5% for media.
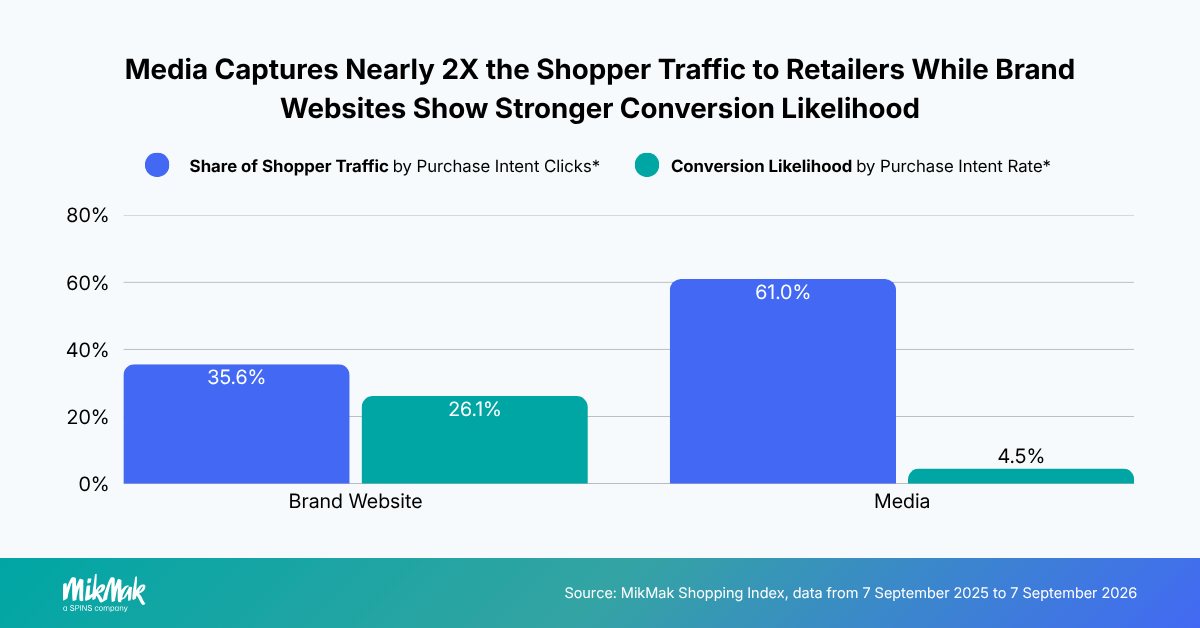
*Purchase Intent Clicks: Measures high-intent shopper traffic by counting the number of times a shopper clicks through to at least one retailer during a single session within MikMak Commerce-enabled brand content
*Purchase Intent Rate: Measures the percentage of shoppers who click through to at least one retailer within MikMak Commerce-enabled brand content, signaling a strong conversion likelihood.
This does not mean that one channel is more valuable than the other. Media and brand websites play complementary roles in the commerce journey:
- Media creates and captures demand at scale. Shoppable media can connect shoppers from brand content to multiple retailer destinations while they discover products across social, search, display, and video. This allows brands to turn moments of discovery into measurable purchase intent and direct sales opportunities.
- Brand websites capture deeper intent. Shoppers who reach a brand website may be further along in their decision-making, researching products, comparing options, or looking for more information before deciding where to buy. Connecting these experiences directly to retailers makes it easier to act when purchase intent is high.
Together, these touchpoints form a connected commerce ecosystem. The goal is to make it easier for shoppers to move from discovery to purchase wherever and whenever they choose to buy, while giving marketers visibility into the signals along the way.
Paid Social is Driving Outsized Performance Across the Media Mix
The sources of shopper traffic to Food and Beverage retailers have shifted throughout 2026. Paid social increased its share of Purchase Intent Clicks from 36.7% in Q1 to 51.0% in Q3, globally. Meanwhile, paid search declined from 31.1% to 23.8%, while organic search fell from 17.7% to 12.1%.
Paid Social Gains Shopper Traffic Share as the Global Media Mix Evolves
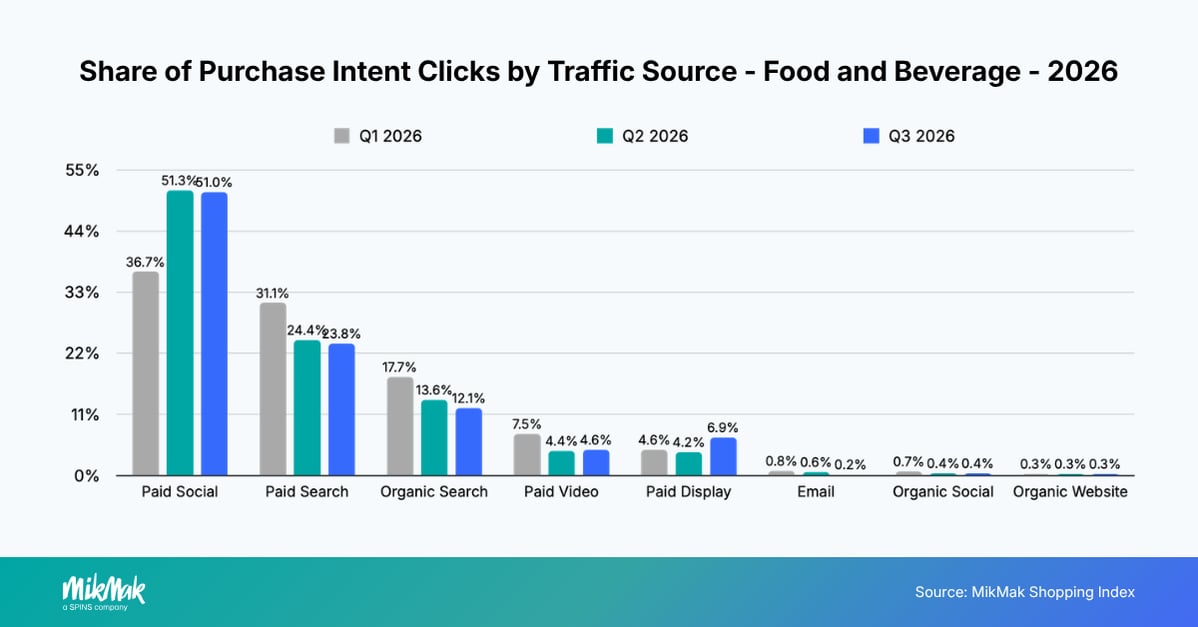
These changes show how the mix of shopper touchpoints captured through commerce-enabled experiences can evolve. However, a change in share does not necessarily indicate a corresponding change in absolute traffic or shopper preference. Media investment, channel mix, seasonality, product mix, and brand activation can all influence the distribution.
The takeaway is that there is no single global channel formula. As the country-level data shows, the sources contributing to Purchase Intent can look very different from one market or season to another, reinforcing the importance of continuously monitoring where intent forms and how effectively each channel connects shoppers to retailers.
The Food and Beverage Path to Purchase Is Becoming More Compressed
The traditional path from awareness to consideration to conversion is becoming less linear. Shoppers can discover a product, research it, and move to a retailer within a single session.
As Simon Rodeiro, VP of Digital Commerce & Omni-Channel Marketing at PIM Brands, noted during a MikMak industry panel:
“The funnel’s not really a funnel anymore. Discovery to conversion is happening much faster. It’s a pancake, right? It’s kind of squished. But in that squished pancake, you have to be ready during an awareness campaign to capture that conversion.”
— Simon Rodeiro, VP of Digital Commerce & Omni-Channel Marketing, PIM Brands

How the Path to Purchase Varies Across Global Markets
Together, these signals show a commerce journey that is increasingly connected, dynamic, and compressed. Media and brand websites play different but complementary roles. The channels capturing purchase intent can shift over time, and shoppers can move from discovery to retailer purchase faster than traditional funnel models suggest.
But there is no single global path to purchase. Local media habits, retailer landscapes, shopping moments, and brand activation shape how purchase intent forms in each market. The following perspectives explore these differences across the US, Canada, UK, and France.
United States
Shopper intent is strengthening as media and retailer paths diversify.
Shopper Traffic Became More Concentrated in H1
US Food and Beverage Purchase Intent Clicks were more concentrated in H1 2026, with a smaller share captured in the final months compared with the previous 12-month period.
First Half of 2026 Captured a Larger Share of Shopper Traffic to Retailers
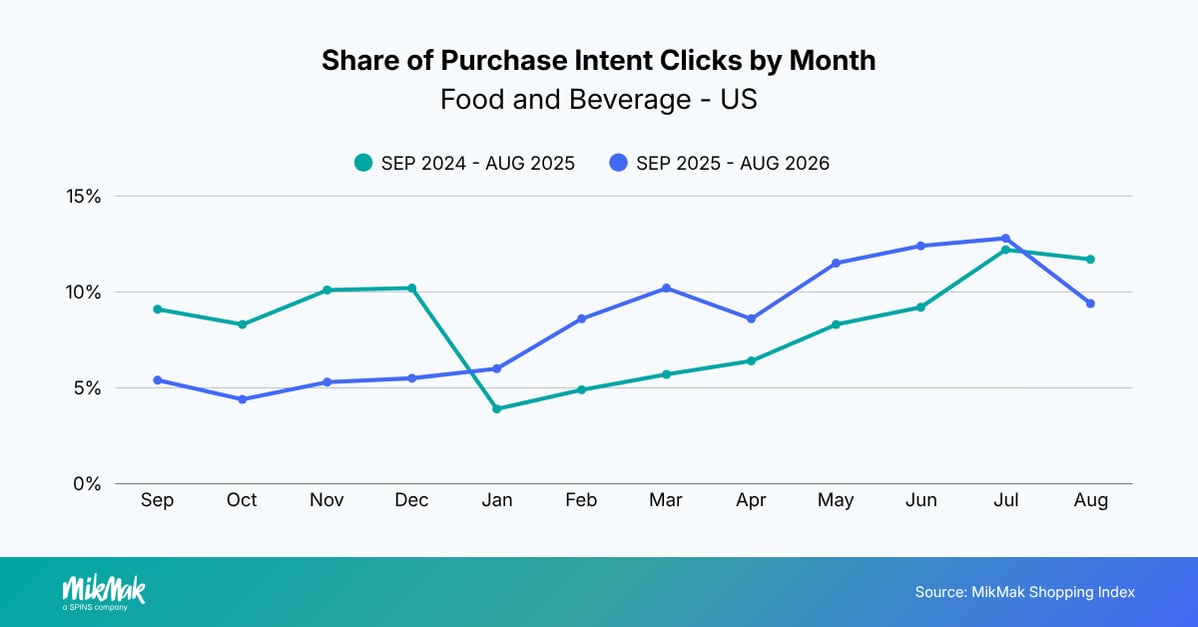
From January through June, the share of Purchase Intent Clicks increased from 38.4% to 57.3% year over year, with June accounting for 12.4% of annual clicks, up from 9.2% in the previous period. Meanwhile, the share captured between September and December declined from 37.7% in 2024 to 20.6% in 2025.
This shift does not necessarily mean underlying Food and Beverage demand has moved away from the latter part of the year. Purchase Intent Clicks can also be influenced by brand activation and media investment, meaning patterns can vary from year to year.
Purchase Intent Strengthened Across Media and Brand Websites
Purchase Intent Rate increased across both brand websites and media, indicating a stronger conversion potential.
Conversion Likelihood Increased on Media and Brand Websites
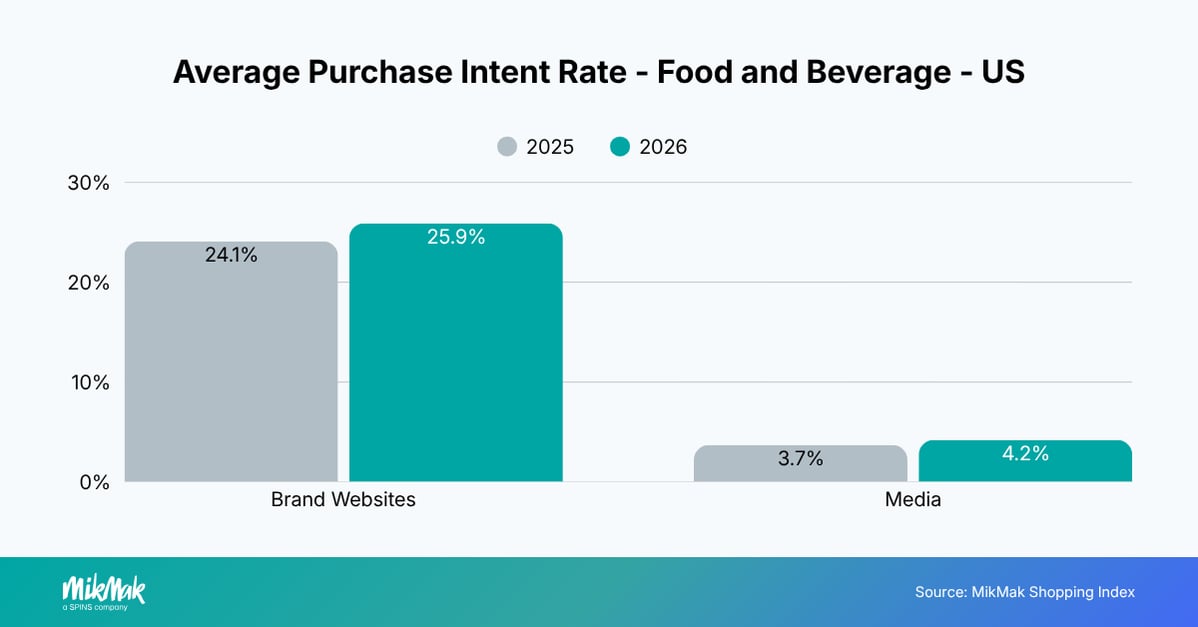
The difference between the two reinforces their complementary roles. Brand websites tend to capture shoppers further along the path to purchase, while media reaches shoppers earlier in their journey at greater scale.
The Media Mix Is Becoming More Diversified
The sources driving shopper traffic to retailers also shifted. Paid social remained the largest traffic source in 2026, but its share declined from 39.3% to 33.5%. Organic search increased from 21.9% to 25.9%, while paid display grew from 8.4% to 10.6%.
Paid Social Remained the Leading Source for Shopper Traffic
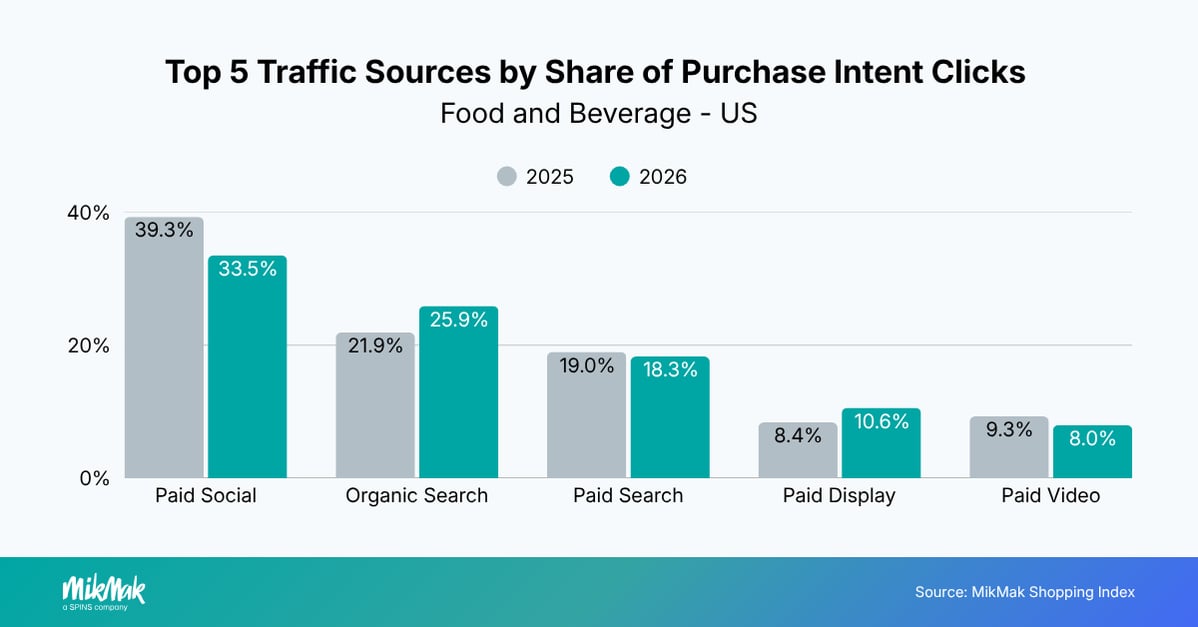
These changes reflect both how shoppers discover and engage with brands and where brands are investing. As marketers diversify their channel mix, the distribution of Purchase Intent Clicks captured through commerce-enabled experiences can shift with it. Media investment should therefore be considered alongside shopper signals when evaluating changes in Purchase Intent.
The platform mix tells a similar story. Google remained the largest individual media platform, but its share declined from 43.2% to 32.6%, while YouTube grew substantially from 3.0% to 26.5%. Meta declined from 30.2% to 22.1%, but remained the third-largest source.
YouTube’s Share of Shopper Traffic Increased Nearly 9X
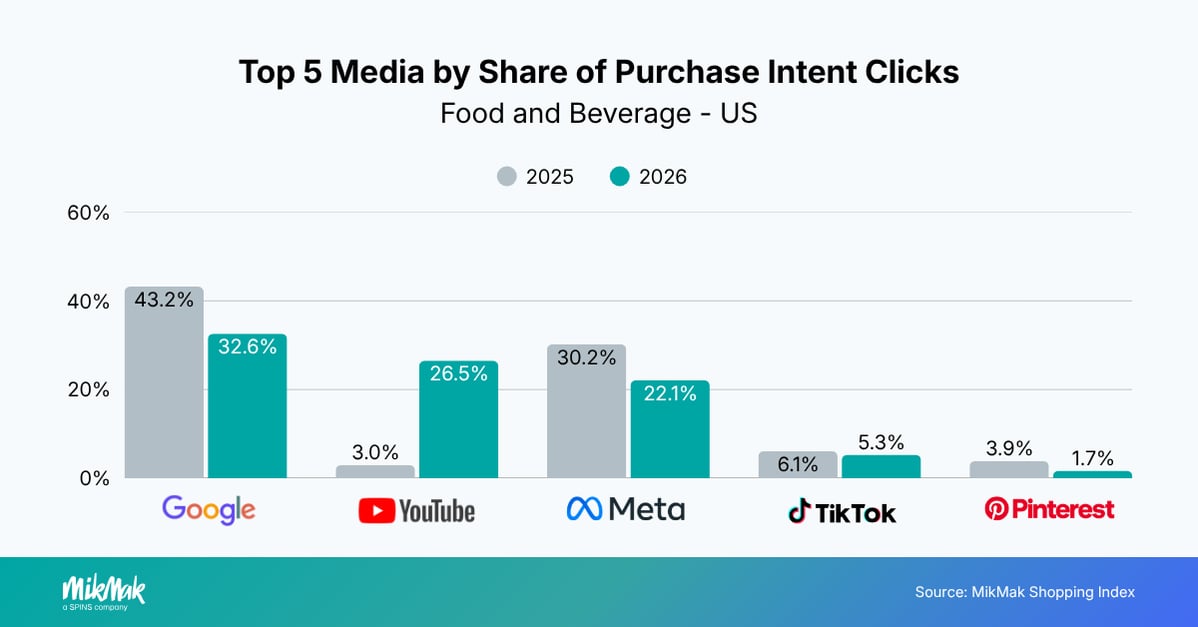
Together, these shifts point to a more diversified mix of channels and platforms contributing to Purchase Intent Clicks.
The US Path to Purchase Spans a Broad Retailer Landscape
Walmart remained the leading retailer capturing shopper traffic in 2026, with a 24.8% share of Purchase Intent Clicks, followed by Target at 12.0%. Instacart increased its share from 7.6% to 8.9%, while Amazon declined from 9.1% to 7.0%.
Top Five Retailers Captured 60% of Shopper Traffic
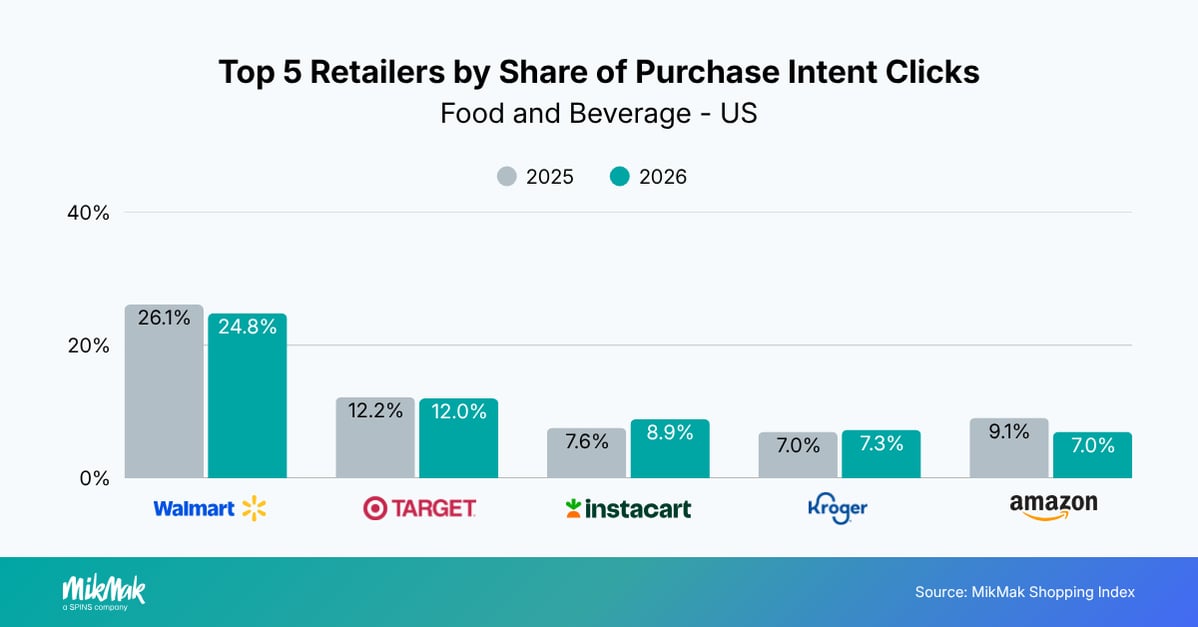
More broadly, the top five retailers accounted for 60.0% of Purchase Intent Clicks in 2026, leaving 38.1% with other retailers. This highlights the breadth of the US Grocery landscape and the challenge of relying on a single retailer destination.
IN PRACTICE:
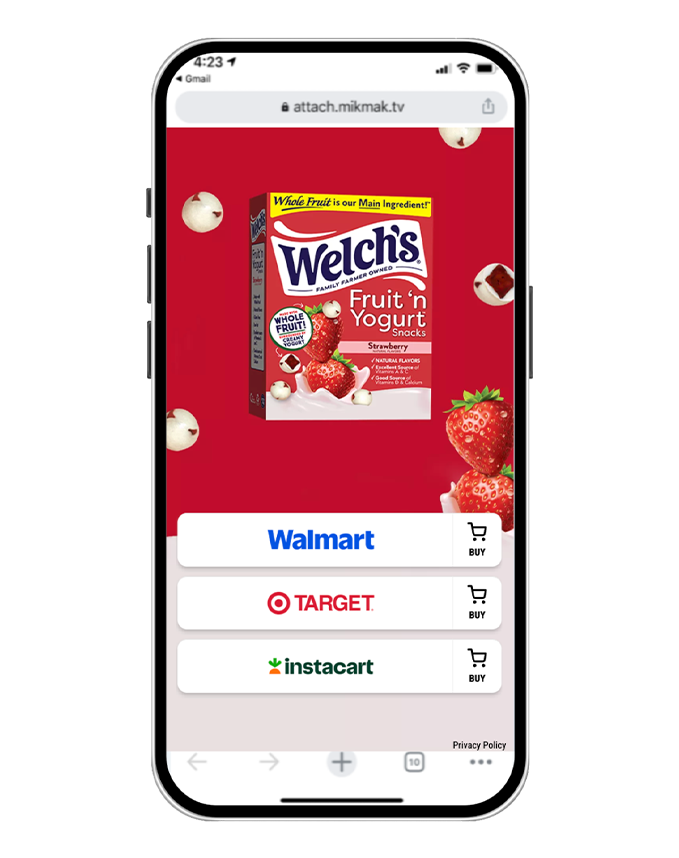
Welch’s Fruit Snacks shows how understanding retailer-level purchase intent can help turn a high-engagement moment into measurable retail results. During a viral campaign, the brand used MikMak to make its content shoppable across retailers and analyze performance by destination.
The team identified Walmart as the strongest conversion driver and optimized its activation accordingly. The campaign generated 1.2M Purchase Intent Clicks at Walmart, with a 5.6% CTR, while Walmart unit sales increased 100% year over year during the campaign period.
Canada
Rapid shifts in timing, media, and retailer choice reveal a highly dynamic commerce journey.
Shopper Engagement Shifts Significantly Across the Year
The biggest increase came in July 2026, which accounted for 28.2% of Purchase Intent Clicks, up from 8.7% in 2025.
July 2026 Emerged as a Major Moment for Shopper Engagement
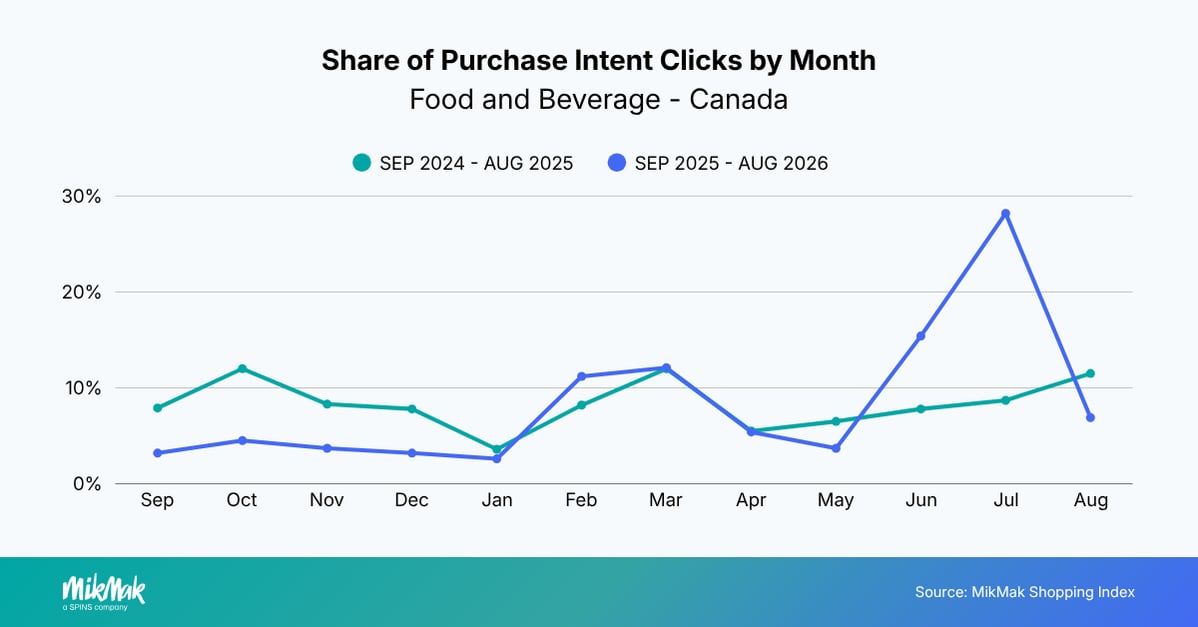
June also saw a notable increase, rising from 7.8% to 15.4%, while March remained virtually unchanged at 12.1%, compared with 12.0% in 2025. By contrast, Purchase Intent Clicks from September through December 2026 fell from 36.0% to 14.6% collectively, while May declined from 6.5% to 3.7%.
The changes highlight how shopper engagement patterns can shift year to year, influenced by factors such as seasonality, product mix, and brand marketing investment.
Purchase Intent Diverges Between Media and Brand Websites
Purchase Intent Rate remained broadly stable on brand websites, increasing from 28.1% to 28.3%, while the rate for media slightly declined from 6.8% to 4.0%.
Conversion Likelihood Held Steady on Brand Websites While Media Slightly Declined
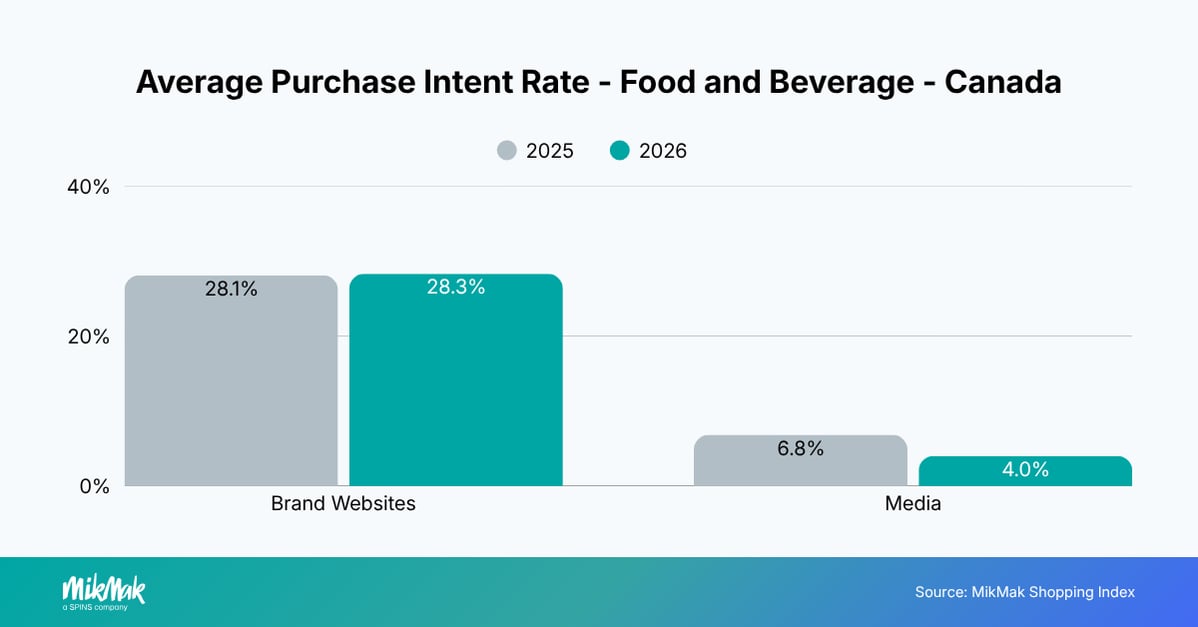
This may reflect a greater focus on driving shoppers to brand websites rather than connecting media directly to retailers, potentially creating missed opportunities to capture Purchase Intent through media.
Media Mix Is Expanding Beyond Paid Social
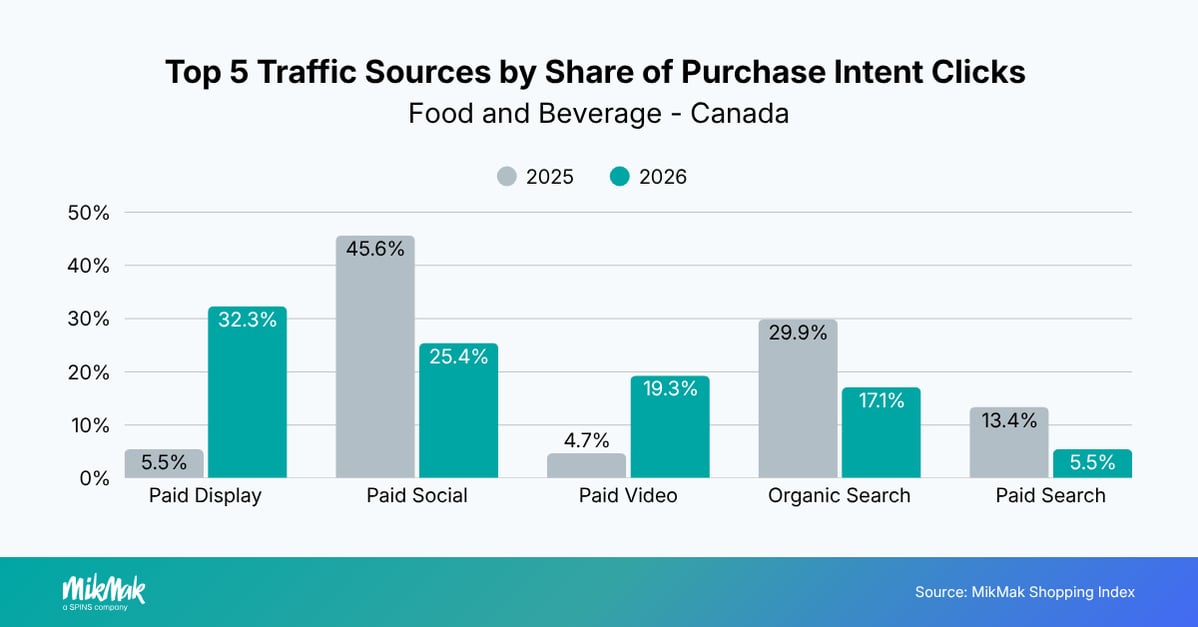
The Canadian media mix changed substantially year over year. Paid social declined from 45.6% to 25.4% of Purchase Intent Clicks, while paid display increased from 5.5% to 32.3% and paid video from 4.7% to 19.3%.
Paid Display Became the Leading Source for Shopper Traffic
The platform mix also shifted. Google increased its share from 41.0% to 51.3%, while Meta declined from 36.3% to 20.6%. YouTube increased modestly from 5.0% to 6.0%.
Google Expanded Its Lead Among Media Platforms
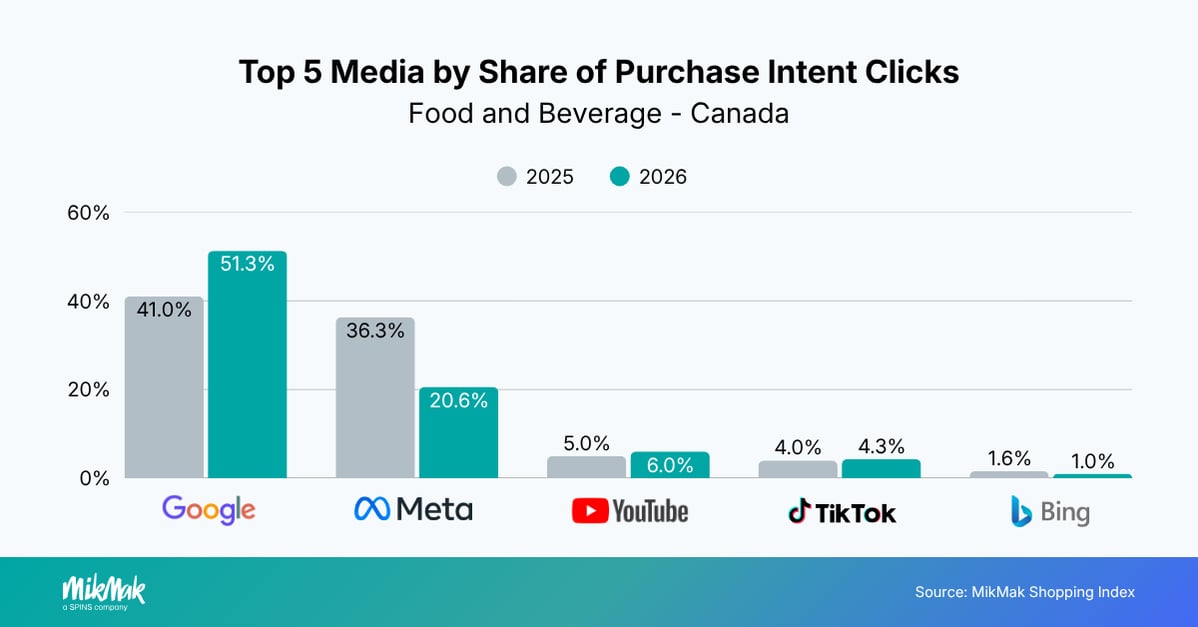
These shifts reflect changes in both media investment and shopper engagement captured through commerce-enabled experiences. As brands adjust their channel mix, the distribution of Purchase Intent Clicks can change with it.
Retailer Choice Became More Concentrated
The retailer mix changed substantially. Walmart remained the leading destination, although its share declined from 37.6% to 27.7% year over year. Meanwhile, Amazon nearly doubled its share from 6.7% to 13.4%, Costco increased from 2.6% to 10.2%, and Loblaws grew from 2.9% to 7.0%.
The Top Five Retailers Captured Nearly 64% of Shopper Traffic
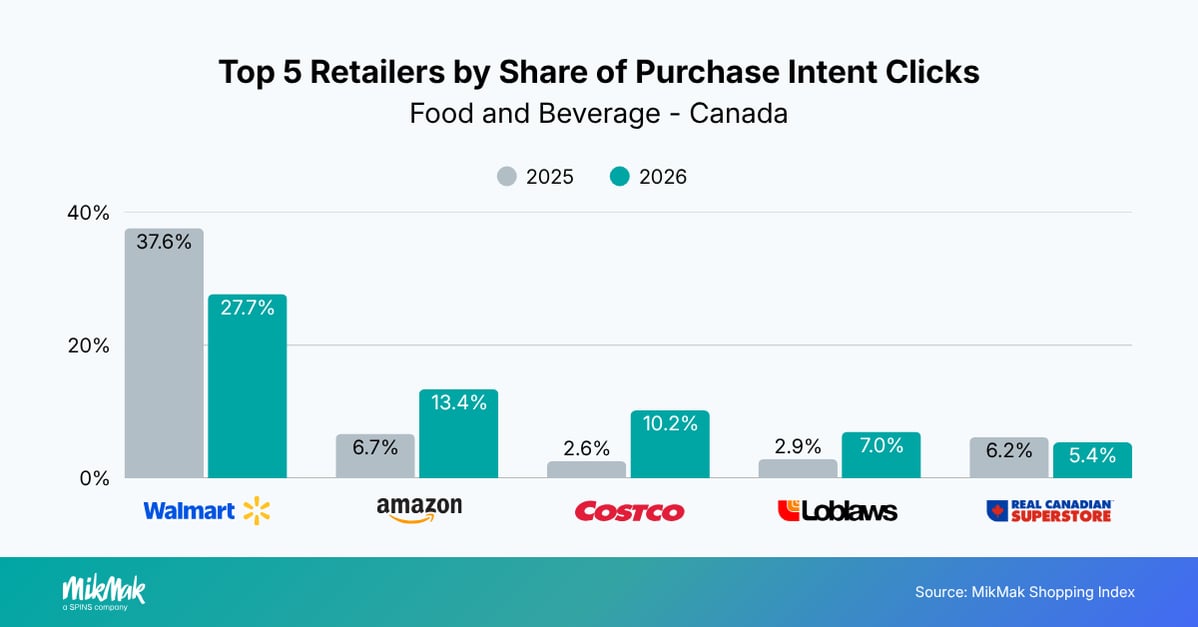
Overall, the top five retailers increased their combined share of Purchase Intent Clicks from 56.0% to 63.7%. While Walmart lost ground, purchase intent became more concentrated among the leading retailers, with the composition of that group changing significantly.
This highlights an important distinction: retailer diversification does not necessarily mean shoppers are spreading evenly across more retailers. Instead, the retailers capturing purchase intent are changing, creating a more dynamic competitive landscape.
IN PRACTICE:
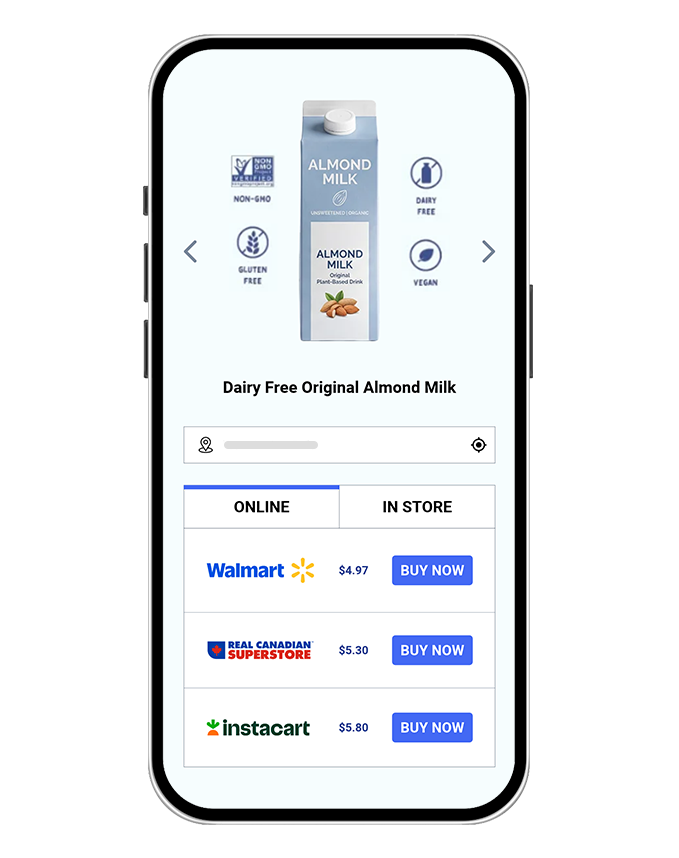
For a plant-based beverage brand in Canada, Walmart and Voilà were placed in the top two positions among featured online Grocery retailers in their MikMak Commerce-enabled media.
This helped the brand direct more shoppers toward its priority retail partners, resulting in a 4.5x higher Purchase Intent Rate on the brand website, a 2.56x higher share of clicks to Walmart and Voilà, and 1.9x more Purchase Intent Clicks to those retailers.
United Kingdom
Search, social, and retailer signals show shopper journeys becoming more distributed.
Shopper Engagement Shifted Away from the Year-End Peak
The timing of Food and Beverage shopper engagement in the UK changed year over year, with a smaller share of Purchase Intent Clicks concentrated between October and December.
Shopper Traffic to Retailers Became More Evenly Distributed Across the Year
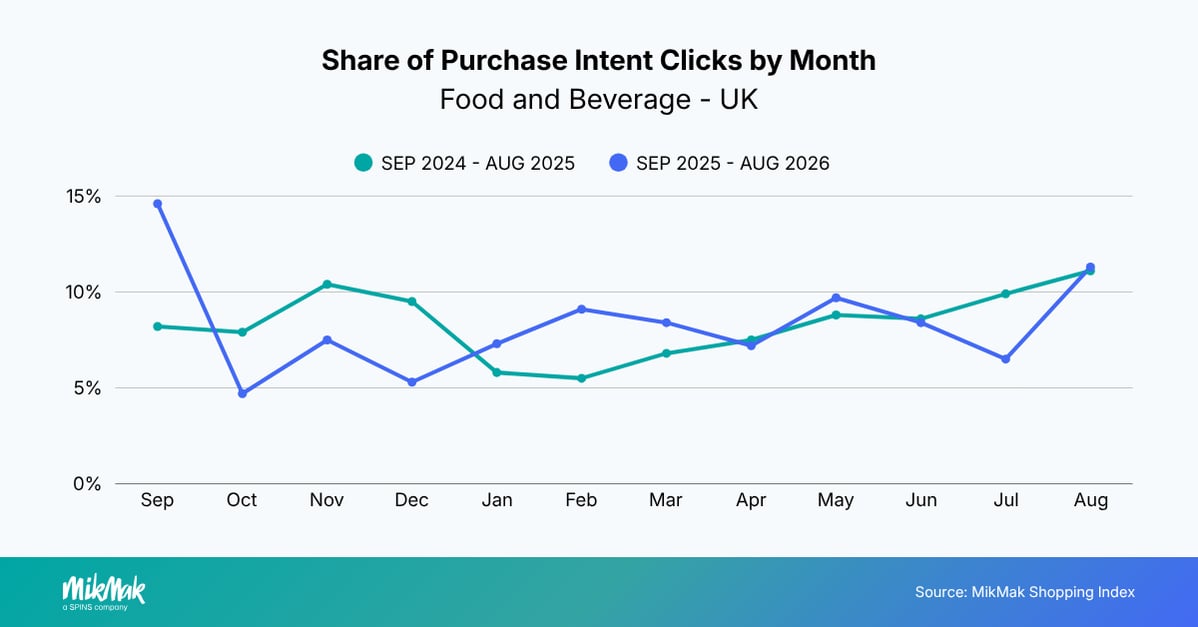
The share of Purchase Intent Clicks from October through December 2025 declined from 27.8% to 17.5%. September moved in the opposite direction, increasing from 8.2% to 14.6%, while February, March, and May also gained share. Overall, the September–December period declined from 36.0% in 2024 to 32.1% in 2025.
Shopper engagement can fluctuate throughout the year, influenced by seasonality, product mix, and the timing and distribution of brand marketing investment. Comparing commerce signals with marketing activity can help brands understand what may be driving these shifts.
Purchase Intent Remained Strong on Brand Websites
Brand websites continued to show strong performance in driving shoppers to retailer checkout options, with average Purchase Intent Rate increasing slightly from 28.1% to 28.3% year over year. The rate for media declined from 6.8% to 4.0%.
Conversion Likelihood Held Steady on Brand Websites While Media Slightly Declined
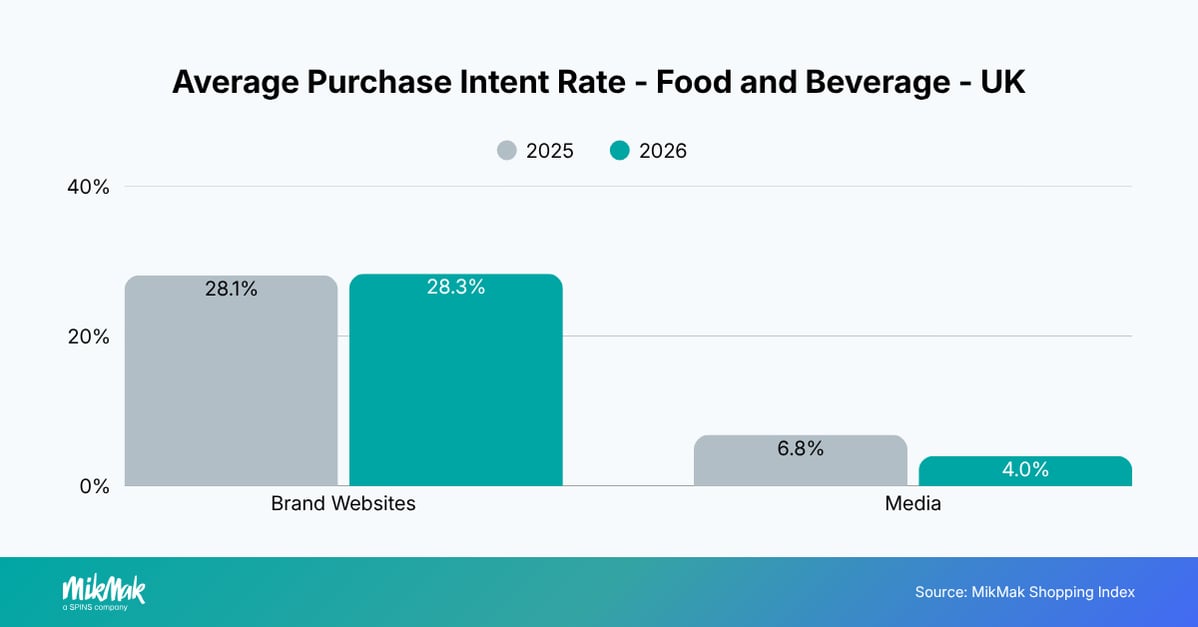
This suggests that brands may have focused on driving traffic to brand websites rather than making media experiences directly shoppable, potentially missing opportunities to capture Purchase Intent through media.
The UK Media Mix Shifted
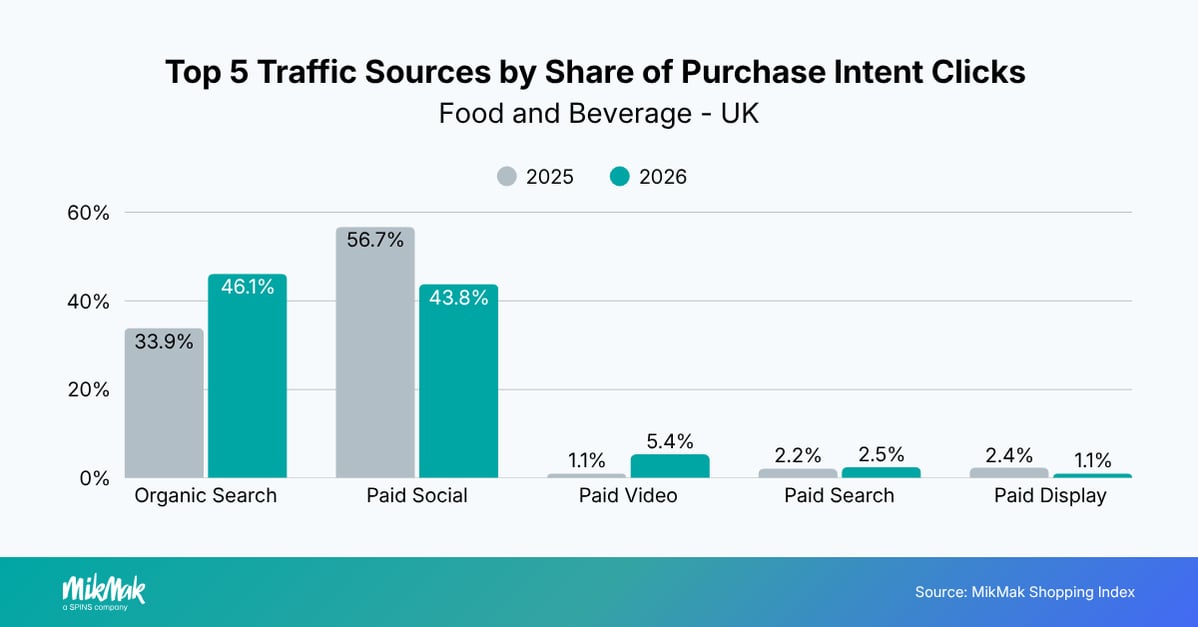
The mix of sources contributing to shopper traffic to retailers changed significantly. Organic search increased its share from 33.9% to 46.1% of Purchase Intent Clicks, while paid social declined from 56.7% to 43.8%. Paid video also increased from 1.1% to 5.4%, while paid search remained relatively stable at 2.5%.
Organic Search Gained Share of Shopper Traffic as Paid Social Declined
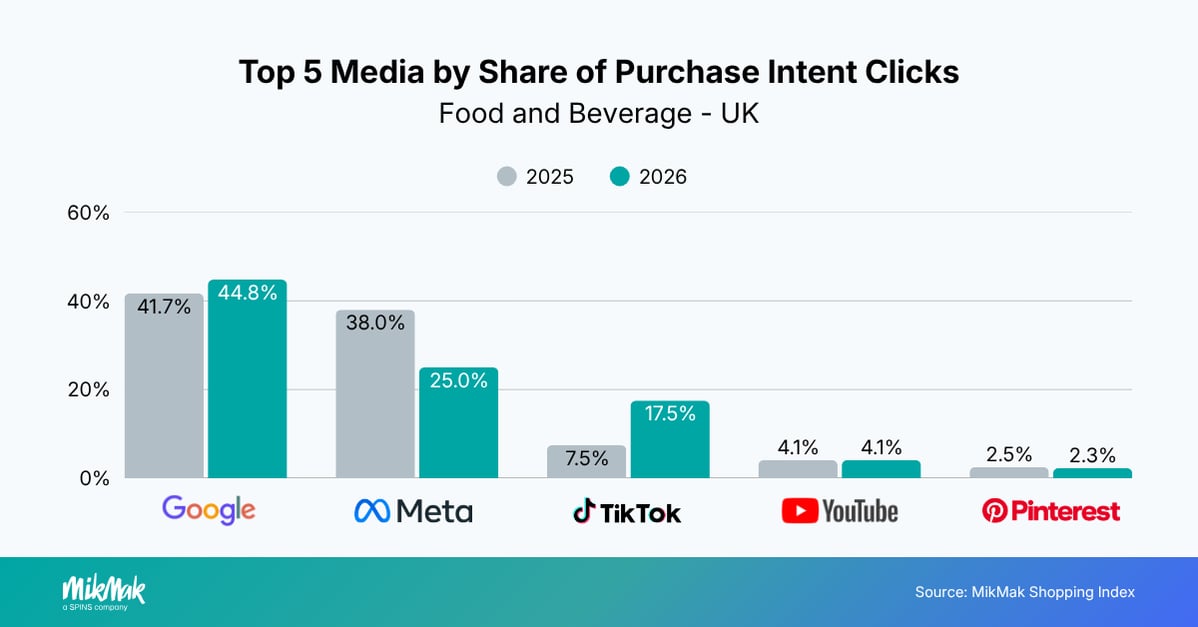
The platform mix changed as well. Google remained the leading media platform, increasing from 41.7% to 44.8%, while Meta declined from 38.0% to 25.0%. TikTok increased its share from 7.5% to 17.5%.
Google Maintained Its Lead as the Media Mix Evolved
These shifts reflect changes in the mix of shopper touchpoints captured through commerce-enabled experiences and can be influenced by media investment, channel mix, product mix, and seasonality. A higher share of organic search does not necessarily indicate higher absolute traffic or greater shopper preference.
The opportunity is therefore not to replace paid activation with organic discovery, but to understand how different channels work together to generate and capture Purchase Intent.
Tesco Gained Ground as Retailer Choice Evolved
Tesco strengthened its position as the leading retailer for Purchase Intent Clicks, increasing its share from 24.6% to 34.4%. Sainsbury's and Asda remained relatively stable at 16.4% and 14.5%, while Morrisons and Ocado declined to 5.4% and 4.4%.
Tesco Increased Its Share of Shopper Traffic
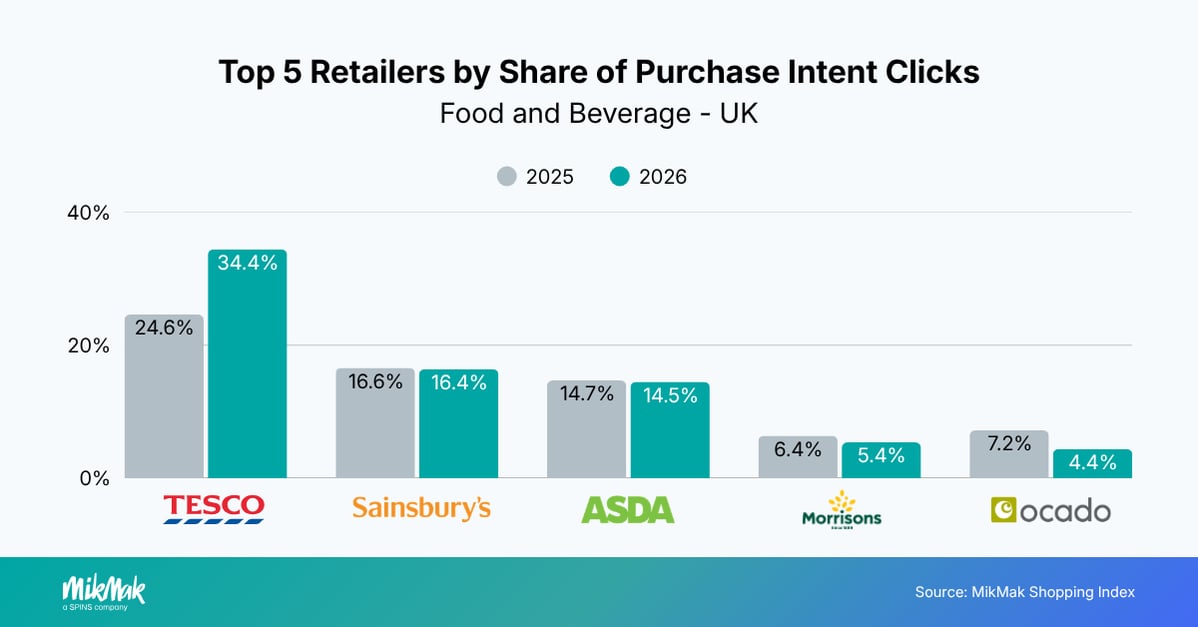
At the same time, the share of other retailers increased from 30.6% to 38.1%, showing that a substantial share of Purchase Intent Clicks continues to go beyond the five leading retailers.
IN PRACTICE:
When a frozen food brand in the UK launched new flavors within a popular product range, the team wanted to maximize awareness and drive demand among high-intent shoppers. Using MikMak Insights, they identified which retailers and channels were most important to shoppers, helping the team optimize media investment and improve campaign performance.
The campaign generated 4.1x more qualified traffic compared with pre-launch performance. 74% of shoppers chose Asda as their preferred retailer for the new flavours, while 86% of traffic came from Meta campaigns.
France
Search remains the defining pathway as purchase intent concentrates among leading retailers.
Shopper Engagement Is Concentrating Around Spring and Early Summer
The timing of Food and Beverage shopper engagement with retailers in France changed significantly year over year, with a much larger share of Purchase Intent Clicks captured in spring and early summer.
Spring and Early Summer Captured a Larger Share of Shopper Traffic
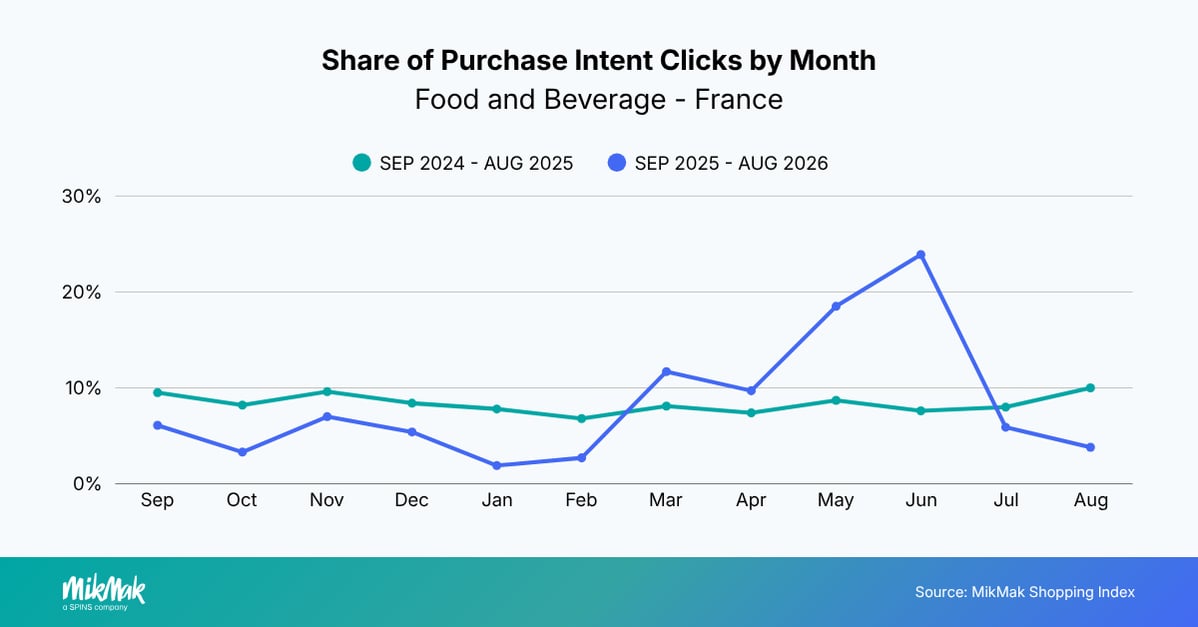
May and June 2026 were particularly notable, accounting for 18.5% and 23.9% of annual Purchase Intent Clicks, respectively, compared with 8.7% and 7.6% in 2025. Together, these two months represented 42.4% of Purchase Intent Clicks, compared with 16.3% previously.
Meanwhile, January and February 2026 saw much lower shares, while engagement from September through December also declined.
The fluctuation of shopper engagement throughout the year can be influenced by seasonality, product mix, and the timing and distribution of brand marketing investment. Brands should therefore look at patterns for their specific categories and product launches to understand what may be driving changes in shopper engagement.
Conversion Effectiveness Strengthened Across Both Media and Brand Websites
Purchase Intent Rate increased across both brand websites and media in France, driving increased conversion likelihood. Average Purchase Intent Rate on brand websites increased from 35.3% to 38.3%, while Media Purchase Intent Rate increased from 2.4% to 9.4%.
Media Purchase Intent Rate Nearly Quadrupled
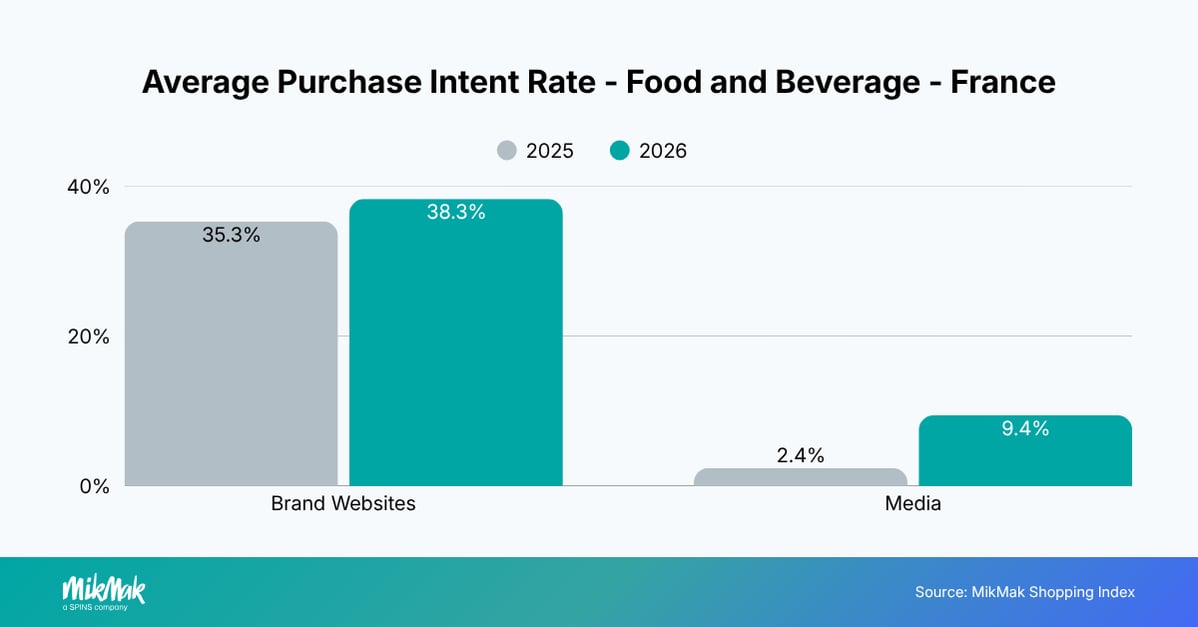
The increase in media Purchase Intent Rate is particularly notable. While media still trails brand websites in absolute Purchase Intent Rate, the change indicates a larger share of shoppers engaging with commerce-enabled media clicked through to retailers in the latest period.
The contrast also reinforces the complementary roles of the two environments. Brand websites continue to capture shoppers with a high likelihood of retailer engagement, while media can create and capture purchase intent earlier in the journey. The opportunity is not to prioritize one environment over another, but to understand how effectively each contributes to the path to purchase and where stronger connections to retailers can improve the shopper experience.
Search Remained Central to the Path to Purchase
France stands out for the dominance of search among the sources contributing to shopper traffic to retailers. Organic search accounted for 73.1% of Purchase Intent Clicks in 2026, down from 86.3% in the previous period, while paid search increased substantially from 8.0% to 24.4% year over year.
Paid Search Gained Share of Shopper Traffic
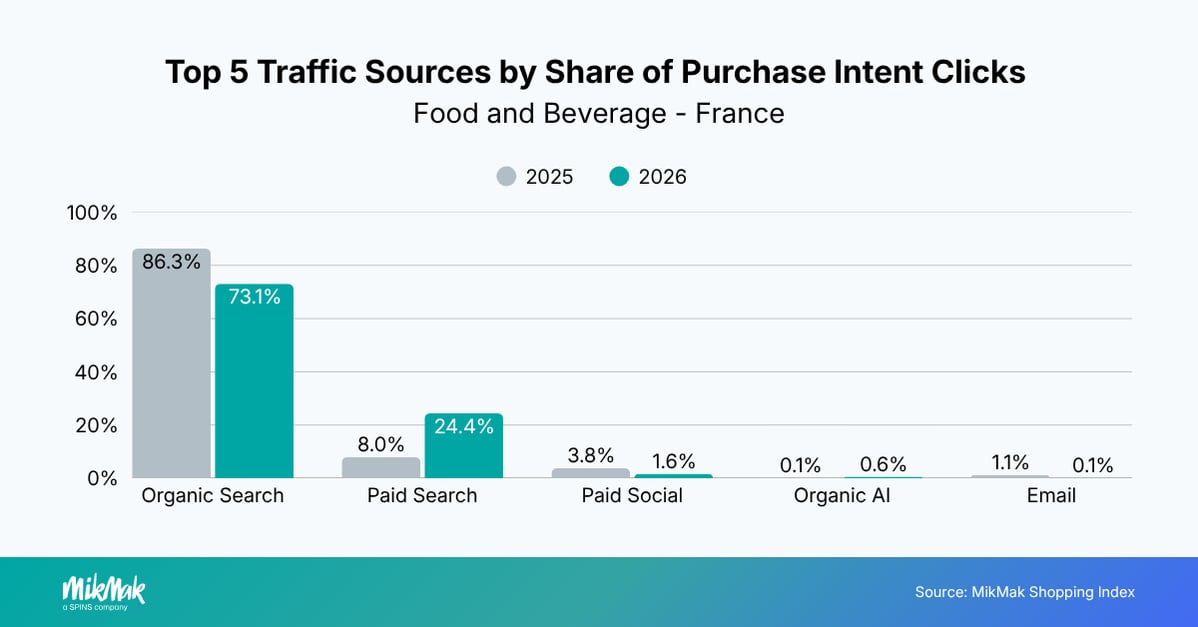
The shift shows that search remains the central pathway captured through commerce-enabled experiences in France, while the balance between organic and paid search is changing. This distribution can be influenced by media investment, channel mix, seasonality, and product mix, so changes in share do not necessarily indicate corresponding changes in absolute traffic.
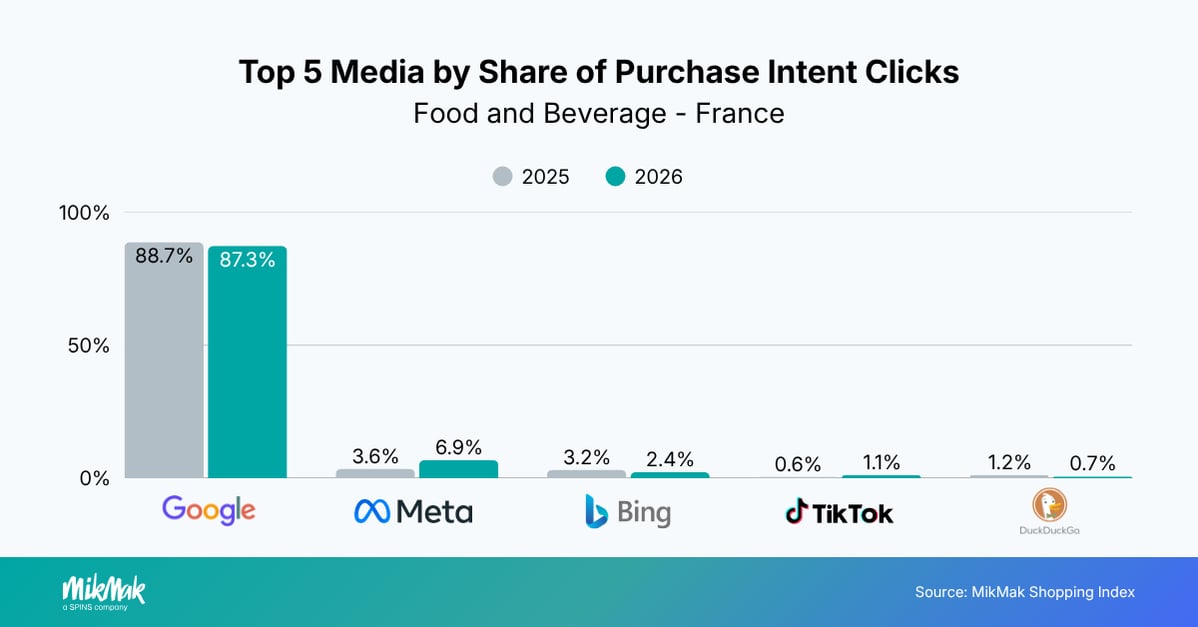
The platform data reinforces this search-led environment. Google accounted for 87.3% of media-driven Purchase Intent Clicks, remaining broadly stable compared with 88.7% previously. Meta increased from 3.6% to 6.9%, while other platforms remained comparatively small.
Google Remained the Dominant Media Platform
Retailer Choice Became More Concentrated
The retailer landscape in France also changed considerably. Carrefour increased its share of Purchase Intent Clicks from 12.2% to 22.1%, while Intermarché grew from 10.7% to 19.8%. E.Leclerc Drive also increased from 7.4% to 9.5%, and Courses U rose from 1.6% to 6.3%.
Major Grocery Retailers Gained Share of Purchase Intent
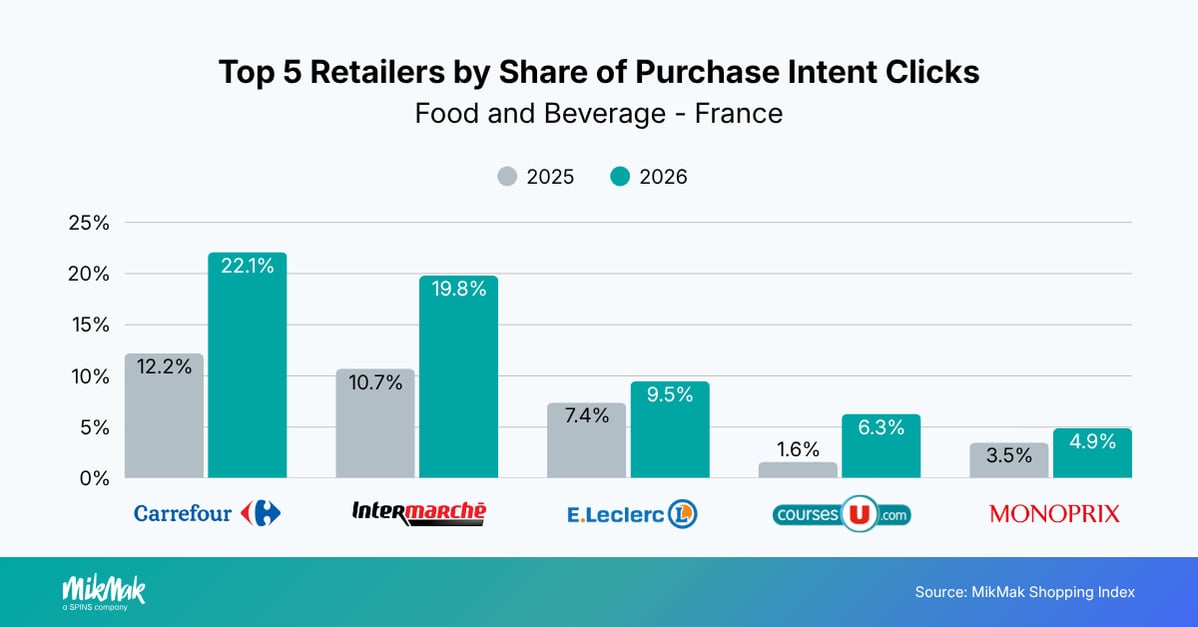
As a result, the combined share of the five leading retailers increased from 35.5% to 61.9%, while the share attributed to Other retailers fell from 64.5% to 38.1%. This points to a more concentrated retailer landscape, with a larger share of captured Purchase Intent Clicks going to leading Grocery destinations.
IN PRACTICE:
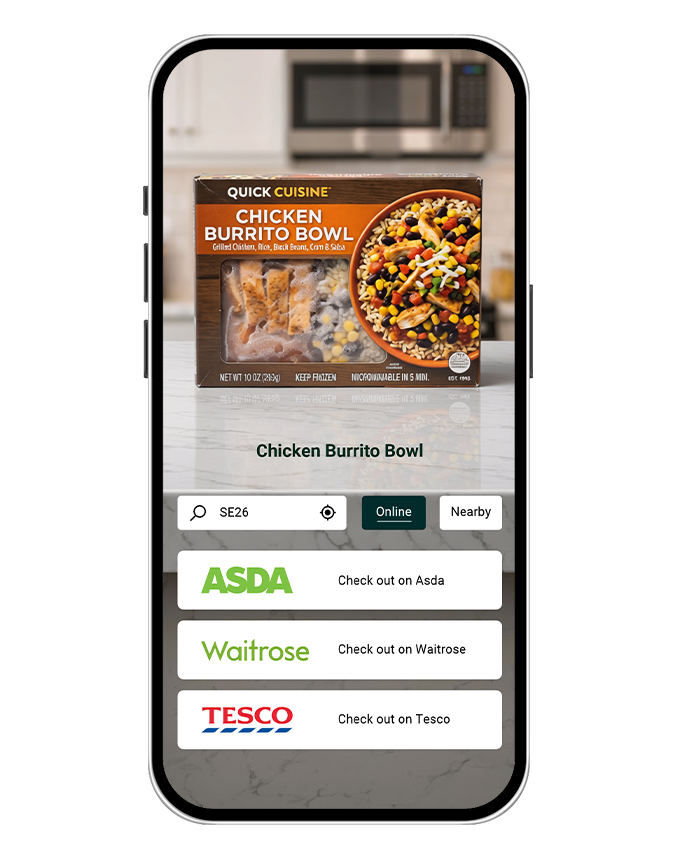
See how Food and Beverage brands in France connect shoppers to online and in-store retailers directly from their websites, creating a clear path from product discovery to purchase.
What Brands Can Do: Turn Commerce Signals Into Growth
Across markets, growth depends on understanding where shopper intent is forming and making it easier for shoppers to act on it. As media environments diversify, retailer choices evolve, and engagement shifts throughout the year, brands need to connect signals across the journey to make smarter decisions about where, when, and how to invest.
1. Connect Your Website and Media to Commerce Outcomes
Understand which channels are contributing to retailer engagement, not just traffic to your website or media delivery.
In practice: Make your website and media shoppable with a solution like MikMak Commerce, then measure Purchase Intent to identify your high-performing audiences, creatives, and channels, and where to optimize or test new opportunities.
2. Plan Around Real-Time Signals, Not Just Seasonal Assumptions
Identify when and where shopper intent is building, rather than relying solely on historical, seasonal, or peak holiday patterns.
In practice: Use commerce analytics like MikMak Insights to monitor Purchase Intent signals and adjust campaign timing, messaging, and activation to improve effectiveness and profitability. Additional AI tools like Analyze with Mak make those insights easier to act on by letting teams ask questions of the data in natural language and quickly surface performance drivers, trends, and opportunities.
3. Prioritize the Right Retailers
Retailer preferences vary by market, region and category, as do availability, delivery options and physical store networks.
In practice: Connect shoppers to relevant retailers with available stock according to their preferences, and use commerce signals from purchase paths to inform retailer activation and partnership strategies.
4. Predict What Comes Next
Move beyond understanding what shoppers did to anticipate what they may do next. Connecting commerce signals with media investment, retailer outcomes, and predictive modelling can help brands evaluate scenarios, identify opportunities, and make more informed investment decisions.
In practice: Use predictive commerce intelligence like MikMak Aura to identify where demand is heading and inform future investment decisions.
As shopper behavior continues to change, the advantage will come from seeing those shifts early enough to do something about them.
See What Your Commerce Signals Can Tell You
Understand where shoppers are discovering your products, where they want to buy, and which opportunities could drive your next phase of growth with MikMak.

*The MikMak Shopping Index was developed to provide a standardized set of metrics, methodology, and benchmarks to help drive brands’ business results and strategy. It is a collection of key eCommerce KPIs collected across hundreds of brands, over 250 channels, and more than 8,000 retailer integrations worldwide to understand consumer online shopping behavior.